Full Report
The numbers behind Salesforce, Inc.: as-reported financial statements and company metrics for FY2022–FY2026, traced to the source filings, opened with the share-price history those statements have to justify. Every linked figure opens the exact page of the filing it was printed on, with the statement row highlighted. Amounts in US$ millions unless noted.
Reading notes: Salesforce fiscal year ends January 31; 'FY2026' denotes the year ended January 31, 2026. Filing filenames in this corpus are shifted one year: annual_reports/CRM_annual_report_FY2022 is actually the 10-K for the fiscal year ended January 31, 2023 (the FY2023 10-K), and both CRM_annual_report_FY2023 and CRM_annual_report_FY2024 are the 10-K for the year ended January 31, 2024. The corpus contains no standalone fiscal-2022 10-K, so FY2022 columns are cited to the comparative column of the FY2023 10-K (doc_id annual_reports/CRM_annual_report_FY2022). Each year is cited to its own Form 10-K: FY2026 - CRM_annual_report_FY2026, FY2025 - CRM_annual_report_FY2025, FY2024 - CRM_annual_report_FY2024, FY2023 and FY2022 - CRM_annual_report_FY2022 (the FY2023 10-K, which prints fiscal 2023, 2022 and 2021). Revenue breakdown uses Salesforce's reported 'subscription and support revenue by service offering' cut. The service offering renamed 'Data' to 'Integration and Analytics' in Q4 FY2024, and the FY2026 10-K re-labelled every offering with an 'Agentforce' prefix (Agentforce Sales, Agentforce Service, Agentforce 360 Platform Slack and Other, Agentforce Marketing and Agentforce Commerce, Agentforce Integration and Agentforce Analytics); the underlying figures are unchanged. Row labels use the durable classic names; each year's verbatim quote/anchor matches the label used in that filing.
Share Price — Full Available History — 22 Years
The stock closed at $170.77 on Jul 17, 2026 — up 15,786% over the window shown (+25.8% a year), trading between $0.60 and $367.87. At that close the stock trades at 22× FY2026 diluted EPS as reported below.
Source: market price feed, monthly closes, sampled from 5,552 source observations, Jun 2004–Jul 2026. Price return only, excludes dividends. Prices are split-adjusted (1:4 on Apr 18, 2013).
Market capitalization $119.5bn and enterprise value $126.7bn.
Market cap = 700.0M shares outstanding × the Jul 17, 2026 close of $170.77. Enterprise value adds total debt of $14.4bn and subtracts cash and equivalents of $7.3bn (net debt of $7.1bn), from the FY2026 balance sheet. Market-derived figures, shown without filing links.
FY2026 at a Glance
Revenue (US$ millions)
Net income (US$ millions)
Diluted EPS
Source: FY2026 consolidated statements [1] [2] [3] [4]. Click any linked figure to open the filing page with the row highlighted.
Subscription and Support Revenue by Service Offering
| Subscription and Support Revenue by Service Offering | FY2022 | FY2023 | FY2024 | FY2025 | FY2026 |
|---|---|---|---|---|---|
| Sales | 5,989 | 6,831 | 7,580 | 8,322 | 9,028 |
| Service | 6,474 | 7,369 | 8,245 | 9,054 | 9,818 |
| Platform and Other | 4,509 | 5,967 | 6,611 | 7,247 | 8,882 |
| Marketing and Commerce | 3,902 | 4,516 | 4,912 | 5,281 | 5,428 |
| Integration and Analytics | 3,783 | 4,338 | 5,189 | 5,775 | 6,232 |
| Total subscription and support | 24,657 | 29,021 | 32,537 | 35,679 | 39,388 |
| Professional services and other | 1,835 | 2,331 | 2,320 | 2,216 | 2,137 |
| Total revenues | 26,492 | 31,352 | 34,857 | 37,895 | 41,525 |
| Total revenues growth, derived | — | +18.3% | +11.2% | +8.7% | +9.6% |
Source: Note 2. Revenues — Disaggregation of Revenue (subscription by service offering); Consolidated Statements of Operations (professional services, totals) [5] [1] [6] [2]. Click any linked figure to open the filing page with the row highlighted.
Income Statement
Source: Consolidated Statements of Operations [1] [2] [3] [4]. Click any linked figure to open the filing page with the row highlighted.
Columns marked E are consensus analyst estimates from S&P Capital IQ (CapIQ), shown alongside reported results for direct comparison; they are not company guidance.
Estimate source: S&P Capital IQ (CapIQ) consensus, as of 2026-07-22. Estimate figures are S&P Capital IQ consensus (vendor data — no filing page links). EPS and net income use the normalized (adjusted) consensus where the street reports it. Line-item analyst models (segments, drivers, KPIs) are in the Visible Alpha tab.
Balance Sheet
Source: Consolidated Balance Sheets [7] [8] [9] [10]. Click any linked figure to open the filing page with the row highlighted.
Cash Flow
Source: Consolidated Statements of Cash Flows [11] [12] [13] [14]. Click any linked figure to open the filing page with the row highlighted.
Backlog Retention
| Backlog Retention | FY2022 | FY2023 | FY2024 | FY2025 | FY2026 |
|---|---|---|---|---|---|
| Current remaining performance obligation (cRPO) | 22,000 | 24,600 | 27,600 | 30,200 | 35,100 |
| Noncurrent remaining performance obligation | — | 24,000 | 29,300 | 33,200 | 37,300 |
| Attrition rate (trailing twelve months) | — | 7.5% | 8.0% | 8.0% | 8.0% |
Source: company filings [15] [16] [17] [18]. Click any linked figure to open the filing page with the row highlighted.
Revenue by Geography
| Revenue by Geography | FY2022 | FY2023 | FY2024 | FY2025 | FY2026 |
|---|---|---|---|---|---|
| Americas | 17,983 | 21,250 | 23,289 | 25,143 | 27,193 |
| Europe | 6,016 | 7,163 | 8,128 | 8,891 | 10,017 |
| Asia Pacific | 2,493 | 2,939 | 3,440 | 3,861 | 4,315 |
Source: company filings [5] [19] [20] [21]. Click any linked figure to open the filing page with the row highlighted.
Capital Return Workforce
| Capital Return Workforce | FY2022 | FY2023 | FY2024 | FY2025 | FY2026 |
|---|---|---|---|---|---|
| Shares repurchased (millions) | — | — | 36 | 30 | 50 |
| Average share repurchase price | — | — | 210.30 | 260.12 | 254.21 |
| Quarterly dividend declared per share | — | — | — | 0.40 | 0.42 |
| Effective tax rate | 6.0% | 68.0% | 16.0% | 17.0% | 22.0% |
| Employees (headcount) | — | 79,390 | 72,682 | 76,453 | 83,334 |
Source: company filings [22] [23] [24] [25]. Click any linked figure to open the filing page with the row highlighted.
Long-Term Record
| Fiscal year | Total revenue | Income from operations | Net income | Diluted net income per share | Net cash provided by operating activities | Capital expenditures | Total stockholders’ equity |
|---|---|---|---|---|---|---|---|
| FY2017 | 8,437 | 218 | 323 | — | 2,162 | (464) | 8,230 |
| FY2018 | 10,540 | 454 | 360 | — | 2,738 | (534) | 10,376 |
| FY2019 | 13,282 | 535 | 1,110 | — | 3,398 | (595) | 15,605 |
| FY2020 | 17,098 | 297 | 126 | — | 4,331 | (643) | 33,885 |
| FY2021 | 21,252 | 455 | 4,072 | 4.38 | 4,801 | (710) | 41,493 |
| FY2022 | 26,492 | 548 | 1,444 | 1.48 | 6,000 | (717) | 58,131 |
| FY2023 | 31,352 | 1,030 | 208 | 0.21 | 7,111 | (798) | 58,359 |
| FY2024 | 34,857 | 5,011 | 4,136 | 4.20 | 10,234 | (736) | 59,646 |
| FY2025 | 37,895 | 7,205 | 6,197 | 6.36 | 13,092 | (658) | 61,173 |
| FY2026 | 41,525 | 8,331 | 7,457 | 7.80 | 14,996 | (594) | 59,142 |
Source: consolidated statements across filings; older years from the standardized feed [11] [1] [7] [12]. Click any linked figure to open the filing page with the row highlighted.
Operating KPIs
| KPI | FY2022 | FY2023 | FY2024 | FY2025 | FY2026 |
|---|---|---|---|---|---|
| Remaining performance obligation | 43,700 | 48,600 | 56,900 | 63,400 | 72,400 |
Source: company-reported operating metrics [26] [27] [28] [29]. Click any linked figure to open the filing page with the row highlighted.
Analyst Consensus
Mean target
Median target
High target
Low target
Street ratings: 34 strong buy, 5 buy, 12 hold, 2 sell. Consensus: Buy.
Estimate source: S&P Capital IQ (CapIQ) consensus, as of 2026-07-22. Estimate figures are S&P Capital IQ consensus (vendor data — no filing page links). EPS and net income use the normalized (adjusted) consensus where the street reports it. Line-item analyst models (segments, drivers, KPIs) are in the Visible Alpha tab.
Traceability
305 of 460 figures on this page (66%) link to the filing page where they are printed — click a linked figure to open the source PDF at that page with the row highlighted. Unlinked figures come from standardized data feeds or pre-filing years.
Salesforce fiscal year ends January 31; 'FY2026' denotes the year ended January 31, 2026.
Filing filenames in this corpus are shifted one year: annual_reports/CRM_annual_report_FY2022 is actually the 10-K for the fiscal year ended January 31, 2023 (the FY2023 10-K), and both CRM_annual_report_FY2023 and CRM_annual_report_FY2024 are the 10-K for the year ended January 31, 2024. The corpus contains no standalone fiscal-2022 10-K, so FY2022 columns are cited to the comparative column of the FY2023 10-K (doc_id annual_reports/CRM_annual_report_FY2022).
Each year is cited to its own Form 10-K: FY2026 - CRM_annual_report_FY2026, FY2025 - CRM_annual_report_FY2025, FY2024 - CRM_annual_report_FY2024, FY2023 and FY2022 - CRM_annual_report_FY2022 (the FY2023 10-K, which prints fiscal 2023, 2022 and 2021).
Revenue breakdown uses Salesforce's reported 'subscription and support revenue by service offering' cut. The service offering renamed 'Data' to 'Integration and Analytics' in Q4 FY2024, and the FY2026 10-K re-labelled every offering with an 'Agentforce' prefix (Agentforce Sales, Agentforce Service, Agentforce 360 Platform Slack and Other, Agentforce Marketing and Agentforce Commerce, Agentforce Integration and Agentforce Analytics); the underlying figures are unchanged. Row labels use the durable classic names; each year's verbatim quote/anchor matches the label used in that filing.
Remaining performance obligation (RPO) is disclosed by Salesforce in billions; the KPI value is expressed in US$ millions to match the tab scale (e.g. FY2026 $72,400M = the filed $72.4 billion), while the citation anchor is the printed billions figure.
FY2017-FY2021 long-term figures are from the standardized SEC XBRL data feed and are shown without page links; FY2017-FY2020 diluted EPS is not carried in the feed and is left blank.
No quarterly block: the indexed 8-K earnings documents carry only the cover Form 8-K, not the Exhibit 99.1 press-release statements, and building a contiguous multi-quarter set from the 10-Qs would require unblessed Q4 income derivation; the renderer's numeric-feed fallback covers quarterly.
1 figure(s) differed between the data feed and the filing; the filing value is shown (see the run's metrics/metrics_tab.json for the audit trail).
Salesforce, Inc.'s management answers for the business every quarter. These are the exchanges that explain it best — verbatim, from the call transcripts preserved in Sources. Each link opens the full transcript at that page in a new tab.
Q4 & Full Year FY2026 Earnings Call — Q4 FY2026
Where the agentic bet lands: a $41.5B year, a raised FY30 target, a $50B buyback into a 'not rational' market, and the first sizing of Agentforce. · Open the full transcript →
The pushback: if Agentforce is booming, why did CRPO growth slip to 9%?
Keith Weiss (Analyst, Morgan Stanley); Robin Washington (CFO): Congratulations on a solid end to FY '26, especially with the numbers associated with Agentforce. However, CRPO growth was somewhat disappointing, growing at 9%. Can you talk about the ability of Salesforce to grow the Agentforce business while also bringing along the entire portfolio of products? […] We're monetizing AI in multiple ways and are seeing great growth in our premium SKUs. Our seats are continuing to grow. We're excited about the incremental value that Agentforce brings, which was illuminated through our customer successes shared today.
p. 3 · Read in context →
How agent usage monetizes — and why management expects gross margin neutral near term.
Gabriela Borges (Analyst, Goldman Sachs); Robin Washington (CFO): Can you explain the $2.4 billion in AWUs? How do you monetize this, and what impact does i have on gross margin? […] In the short run, we anticipate being neutral on gross margins. We're building efficiencies into our product development to control costs and drive margins higher over time.
p. 4 · Read in context →
Q3 FY2026 Earnings Call — Q3 FY2026
The clearest walk-through of how AI revenue is priced, how the data 'foundation' becomes a ~$10B business, and how guidance is framed around reacceleration. · Open the full transcript →
The AI revenue base, quantified: Agentforce ARR up 330%, and the consumption flywheel.
Robin Washington (Chief Operating and Finance Officer): More than 70% of our top 100 wins included five or more clouds. In pricing and packaging, new bookings for agent force one edition and a for x, or as we call it, agent force for apps, our most premium SKU, doubled quarter over quarter. Our consumption flywheel is spinning. Agent force accounts and production increased 70%. Quarter over quarter. And more than 50% of agent force bookings came from customers refilling the tanks. Agent force and data 360 ARR was up 100% year over year. This is inclusive of agent force ARR, which is up 330% year over year.
p. 7 · Read in context →
Guidance philosophy: organic first, layer the acquisition, and a stated reacceleration window.
Robin Washington (Chief Operating and Finance Officer): Turning to guidance. I want to frame our outlook inclusive of Informatica. To help you model this clearly where relevant, I'll give our organic performance, layer in the acquisition impact, and then provide the consolidated figures for Q4 and fiscal year 2026. […] Consistent with our Investor Day outlook, we remain on track to reaccelerate revenue. In twelve to eighteen months.
p. 8 · Read in context →
Q2 FY2026 Earnings Call — Q2 FY2026
The fullest statement of the whole thesis — what the 'agentic enterprise' is, why Data Cloud underpins it, the SaaS-is-dead debate answered head-on, and the capital-allocation framework. · Open the full transcript →
The organizing idea, defined: not an upgrade but a reinvention around humans-plus-agents.
Marc Benioff (Chair and CEO): But this isn't just an upgrade. This isn't simply just some automating some existing business process. These agentic enterprises, well, for Salesforce, it's certainly true. It's a complete transformation. And for our customers, the agentic enterprise is a complete reinvention. In many cases, of who they are and what their potential is. It's a shift from traditional hierarchies to reshaping the entire company from busy work to orchestrating workflows, from siloed teams to seamless collaboration, from clicking and routing to natural conversations, and hours are shrinking to seconds, employees and customers are being augmented. But, ultimately, it's about this: it's about humans and agents working together with every decision grounded in trusted data.
p. 2 · Read in context →
Why the data layer is the real moat — a $7B business and the source of agent accuracy.
Marc Benioff (Chair and CEO): And none of this is possible without Data Cloud. Data Cloud is the heart and soul of the success of these agents because it is providing the data and the metadata that you need and the context to get the accuracy. […] I think the data business is probably the most strategic and most important business for Salesforce going forward. And already, it's a $7 billion business, and data cloud is having a great year. […] over half of the Fortune 500 are already on Data Cloud, but it's really just the very, very beginning.
p. 3 · Read in context →
On the MIT 'AI projects fail' study: management says it predicted the DIY failure rate.
Marc Benioff (Chair and CEO): Over the weekend, I read that MIT study that's becoming very popular which really goes to show, you know, that a lot of companies have thought they were on the right path with generative AI, building their own models, doing it themselves, hooking it all up, and now they're claiming about 94% of those projects have failed. But we've been saying that was gonna happen for the last several years, as you know. But that's not what our customers are saying. Our customers are saying that they're getting phenomenal results and that they have humans and agents working together to create a new level of customer success, or we say it at Salesforce is an agentic enterprise.
p. 7 · Read in context →
A concrete unit-economics story: Falabella's two-month deploy, then a tripled contract.
Miguel Milano (President and Chief Revenue Officer): It's Falabella. It's the largest retailer in Latin America. Their main use case, they have several, but the main use case is where's my order? […] The pilot took two months from idea to production. […] The NPS has increased by 10%, from 70 to 80%. All the digital interactions, most of them, 70% of them have shifted to WhatsApp, and the call volume has dropped by 25%. But the very cool piece of the story here is they started being a decent multi-100,000 customer. Then in May, they came back to refill the tank and they nearly tripled the business on Agent Force and now we are discussing again to double.
p. 9 · Read in context →
Q3 FY2025 Earnings Call — Q3 FY2025
The launch quarter: where 'digital labor' and Agentforce were first laid out, the initial 200 deals were dissected, and consumption pricing at $2 a conversation was introduced. · Open the full transcript →
What the first 200 Agentforce deals actually were: Service Cloud add-ons, 'tip of the iceberg.'
Keith Weiss (Analyst, Morgan Stanley); Brian Millham (President and Chief Operating Officer): When it comes to those 200 deals that you've already signed for Agentforce, maybe you could give us some color on what those deals look like? Do they tend to be upsells? […] We are seeing incredible traction with our customers as add-ons to many of our Service Cloud offerings. Obviously, you know Service Cloud is our largest cloud and our initial Agentforce opportunity is with our Service Cloud customers right now […] those 200 deals, sort of, tip of the iceberg when we think about the opportunity that's ahead of us for Agentforce.
p. 7 · Read in context →
Q1 FY2024 Earnings Call — Q1 FY2024
The origin of the profitability transformation under activist pressure — the 1,000 bps margin jump and buybacks — alongside the first AI 'trust layer' pitch that predates Agentforce. · Open the full transcript →
The honest macro caveat: deal compression and elongated cycles in transactional segments.
Brian Millham (President and Chief Operating Officer): But we're still operating in an uncertain macro environment. Customers continue to scrutinize every deal, and we see elongated deal cycles and deal compression, particularly in our more transactional revenue streams like SMB, create, and close, and self-serve.
p. 3 · Read in context →
More calls
Q1 FY2026 Earnings Call — Q1 FY2026 · 4 pages · Robin Washington's first quarter as CFO and the early-FY26 setup — go here for the initial read on Agentforce adoption and the year's guidance frame before it scaled. · Open →
Q4 & Full Year FY2025 Earnings Call — Q4 FY2025 · 14 pages · The FY25 wrap and CFO handoff (Amy Weaver out, Robin Washington in), where management first framed the path back to double-digit growth by the second half of FY27 and teased Agentforce 2.0. · Open →
Q2 FY2025 Earnings Call — Q2 FY2025 · 4 pages · The last call before Agentforce launched at Dreamforce — useful for the Data Cloud momentum and margin narrative that set the table for the agent story. · Open →
Q1 FY2025 Earnings Call — Q1 FY2025 · 11 pages · A rare stumble quarter (a revenue miss) that tested the transformation story — go here for how management handled decelerating bookings and defended margins. · Open →
Q4 & Full Year FY2024 Earnings Call — Q4 FY2024 · 11 pages · The full-year FY24 proof of the turnaround — completed restructuring, the approach to 30% margins, and the first dividend, for readers tracing the profitability arc. · Open →
Q3 FY2024 Earnings Call — Q3 FY2024 · 11 pages · Mid-transformation execution and the introduction of Einstein Copilot — the bridge between the margin story and the later agent story. · Open →
Q2 FY2024 Earnings Call — Q2 FY2024 · 5 pages · Early AI monetization framing around AI Day and Data Cloud — where the 'AI + Data + CRM' pitch and its pricing first took shape. · Open →
Salesforce, Inc.'s annual reports contain management's most considered account of the business. These are the sections, passages and visual pages worth opening in the originals preserved in Sources.
Salesforce, Inc. — FY2026 Annual Report (Form 10-K) — FY2026
Latest 10-K; the year Salesforce rebranded its clouds under Agentforce, closed the Informatica deal, and crossed $41.5B revenue. · Open the full document →
Item 1. Business — p. 6 · Read the full section →
Management's own framing of the pivot from CRM software to an AI-agent platform, and how it sells.
How Salesforce describes itself in FY2026: a CRM leader remaking every customer into an “agentic enterprise.”
Salesforce, Inc. (“Salesforce,” the “Company,” “we” or “our”) is a global leader in customer relationship management (“CRM”) technology, helping organizations of any size become agentic enterprises. Founded in 1999, we bring humans, agents, applications, and data together on a trusted, unified platform to unlock growth and innovation. […] With Agentforce, the agentic layer of the Agentforce 360 Platform, our customers can build and deploy always-on digital labor for employees and customers, leveraging autonomous AI agents across business functions that aim to increase productivity, lower costs and drive operational efficiencies.
p. 6 · Read in context →
Item 1A. Risk Factors — p. 19 · Read the full section →
The two risks most specific to Salesforce right now: acquisition digestion (Informatica, Slack) and AI reshaping its own markets.
Acquisition risk — the deals may not pay off and could dilute holders; timely given the ~$8B Informatica purchase.
As we acquire companies or technologies, we may not realize the expected business or financial benefits and the acquisitions could prove difficult to integrate, disrupt our business, dilute stockholder value and adversely affect our operating results and the market value of our common stock. […] As part of our business strategy, we periodically acquire complementary businesses, joint ventures, services and technologies and intellectual property rights. We continue to evaluate such opportunities and expect to make such acquisitions and other transactions and arrangements in the future, which may involve numerous risks and could create unforeseen operating difficulties and expenditures
p. 23 · Read in context →
Competition risk — management concedes new AI offerings may disrupt Salesforce's own products and demand.
The markets in which we participate are intensely competitive, and if we do not compete effectively, our operating results could be harmed. […] Additionally, as we continue to increasingly build AI into many of our offerings, we face more competition as AI technologies are increasingly integrated into the markets in which we compete. New AI offerings may disrupt our service offerings or transform workforce needs and negatively impact demand for our offerings
p. 29 · Read in context →
Item 7. MD&A — Overview and Sources of Revenue — p. 54 · Read the full section →
Sets the economic model in one place: one operating segment, ~95% recurring subscription revenue.
One segment, two revenue sources, and subscription at ~95% of the total — the shape of the business.
During fiscal 2026, we experienced strong momentum in Agentforce, Slack and Data 360, bolstered by the acquisition of Informatica. As we have a diversified portfolio of AI-enabled products and a customer base spanning geographies, segments, and industries, demand for our offerings has remained relatively resilient. […] We operate as one segment. […] We derive our revenues from two sources: (1) subscription and support revenues and (2) professional services and other revenues. Subscription and support revenues accounted for approximately 95 percent of our total revenues for fiscal 2026.
p. 54 · Read in context →
Item 7. MD&A — Results of Operations — p. 61 · Read the full section →
The three-year income statement at a glance and management's plain-English read on what drove the 10% top-line gain.
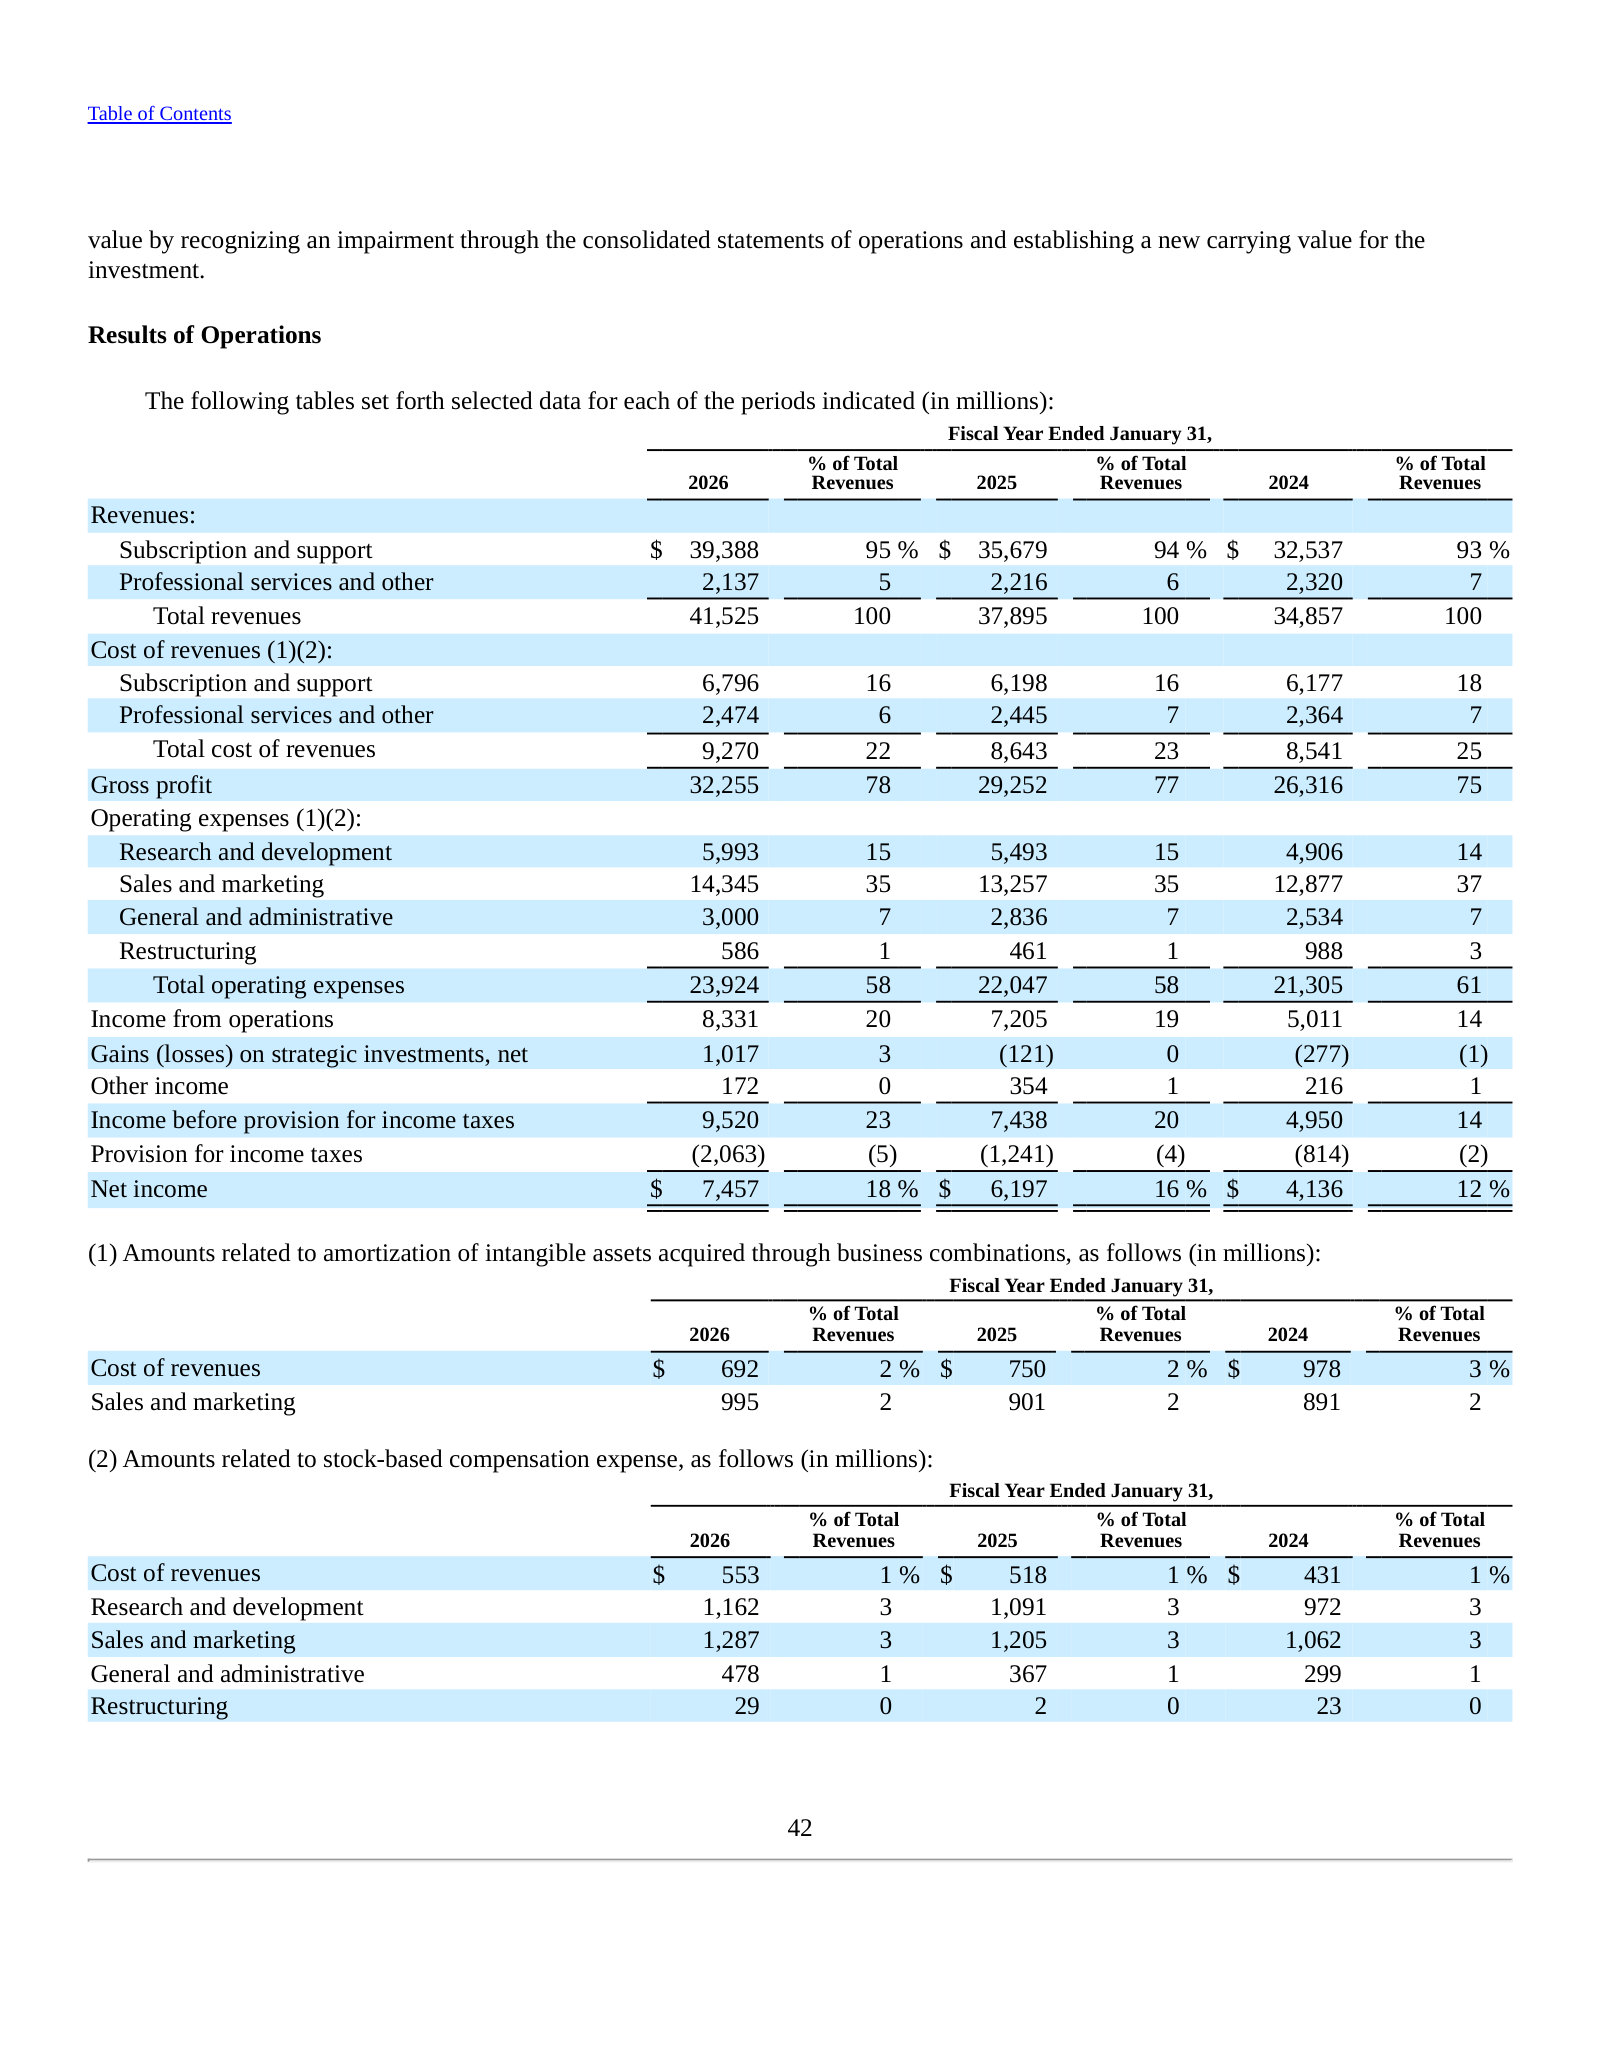
Growth came from volume, not price — new customers and upsell, with pricing not a significant driver.
The increase in subscription and support revenues for fiscal 2026 was primarily caused by volume-driven increases from new business, which includes new customers, upgrades and additional subscriptions from existing customers. Pricing was not a significant driver of the increase in revenues for the period.
p. 62 · Read in context →
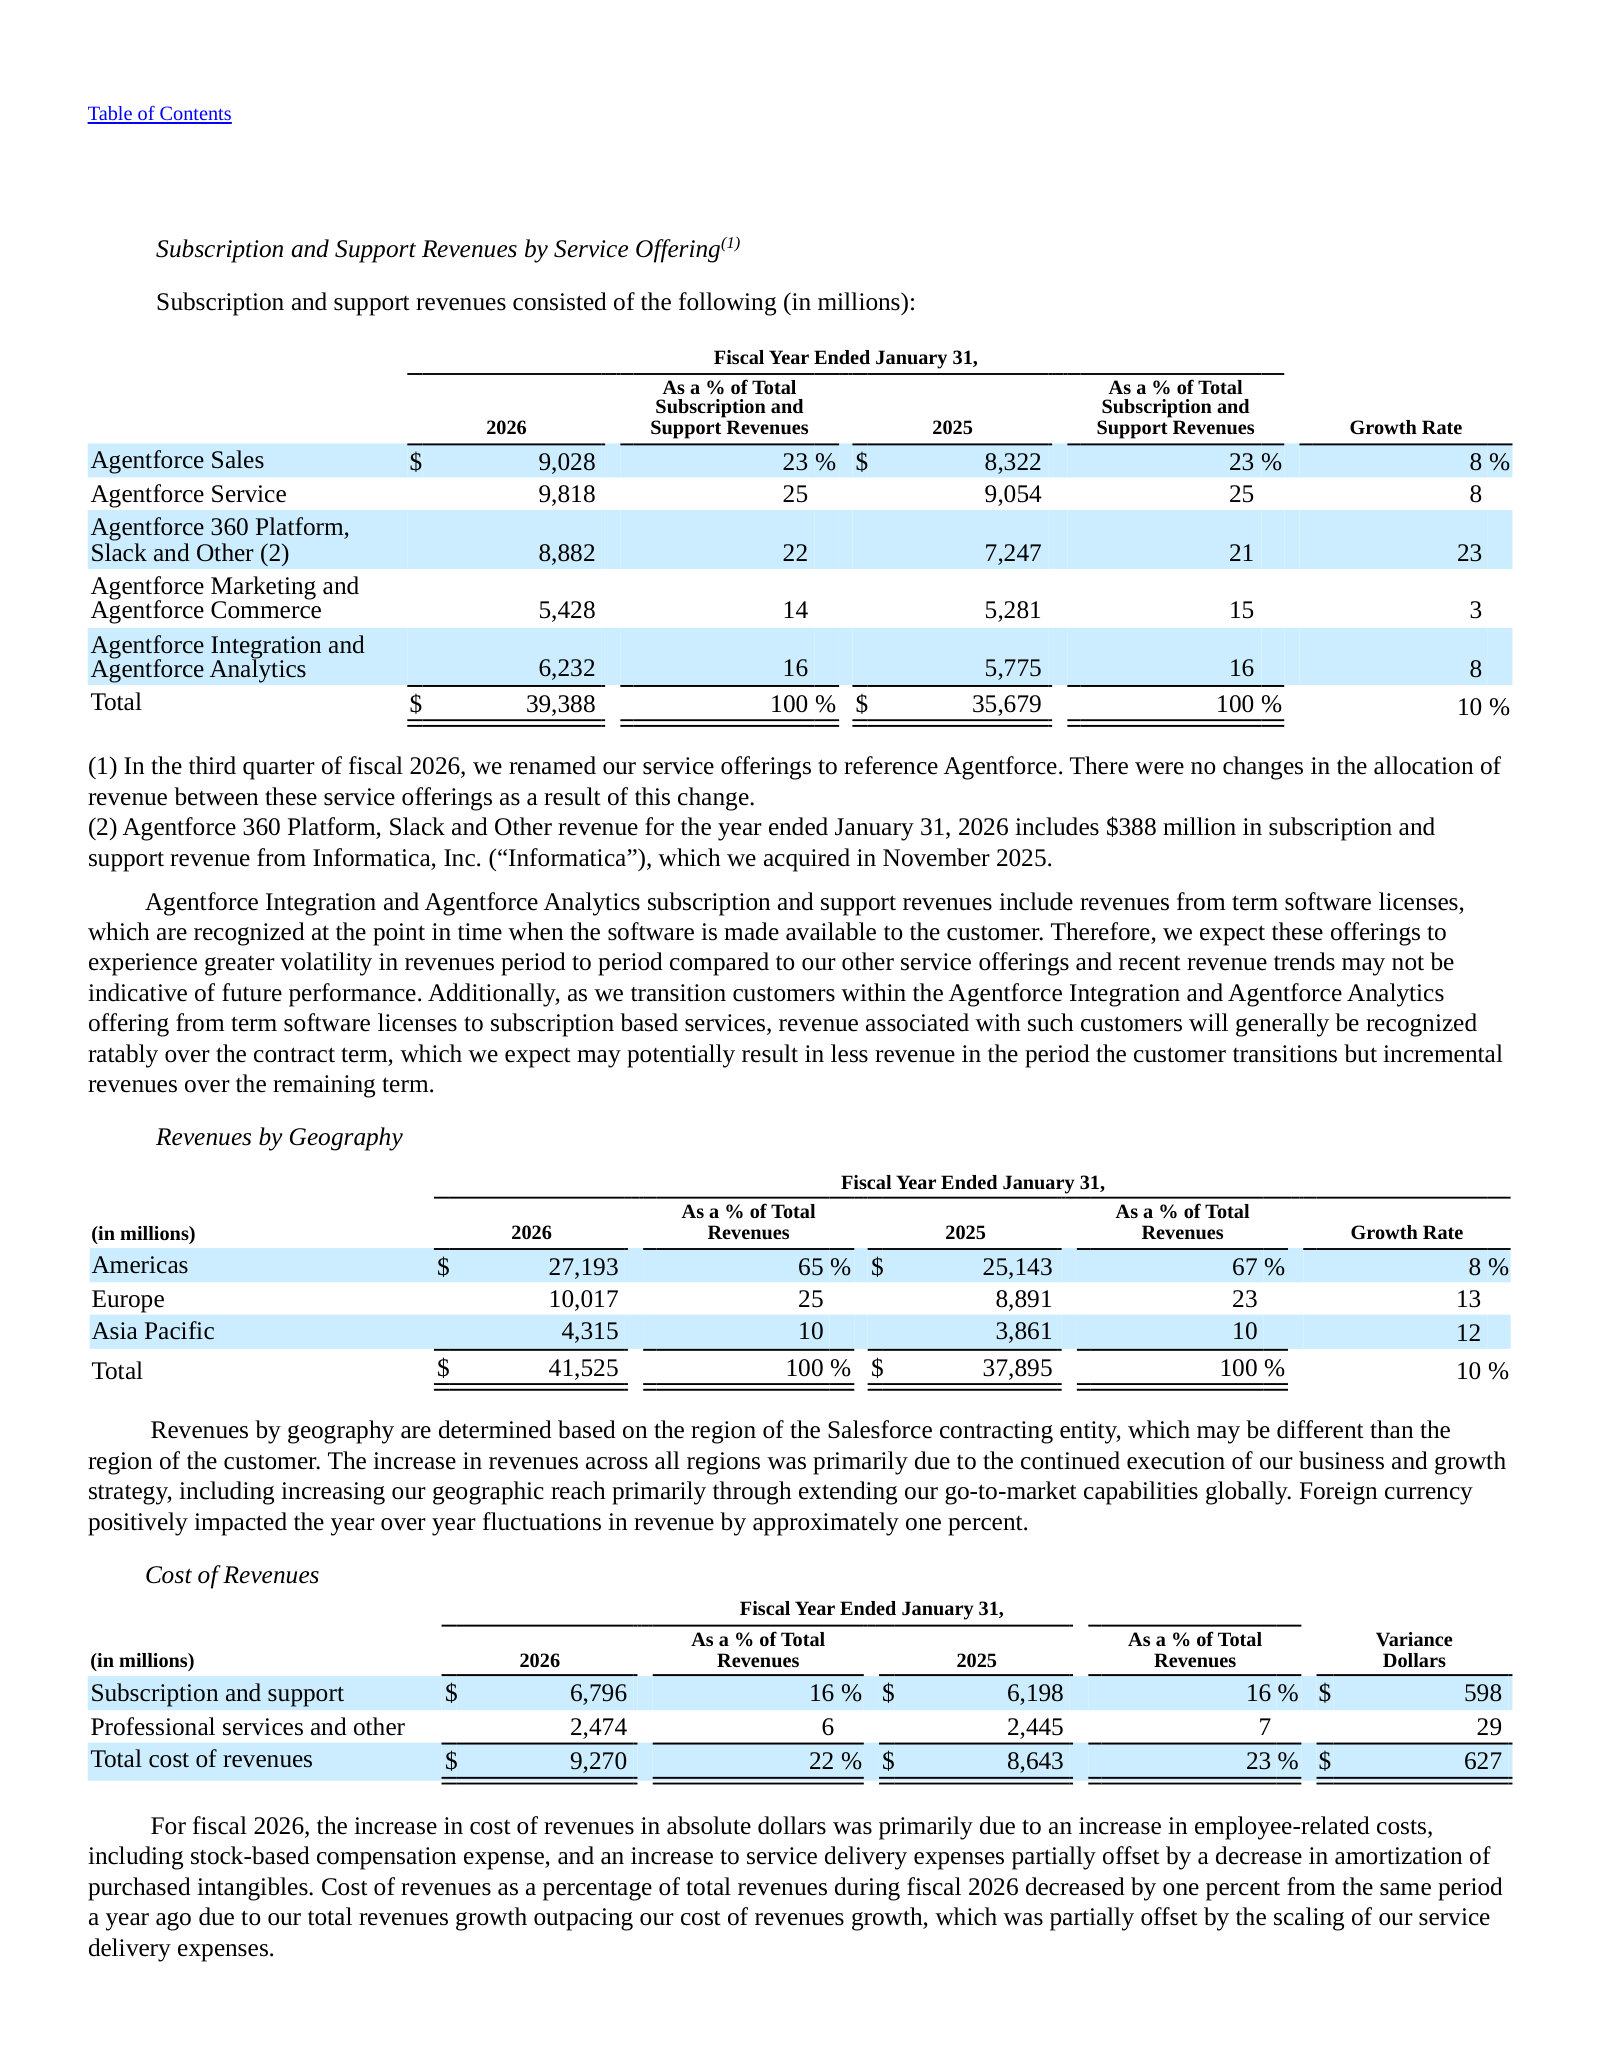
Item 7. MD&A — Subscription and Support Revenues by Service Offering — p. 63 · Read the full section →
The closest thing to a segment breakdown: revenue and growth by product line, plus geography.
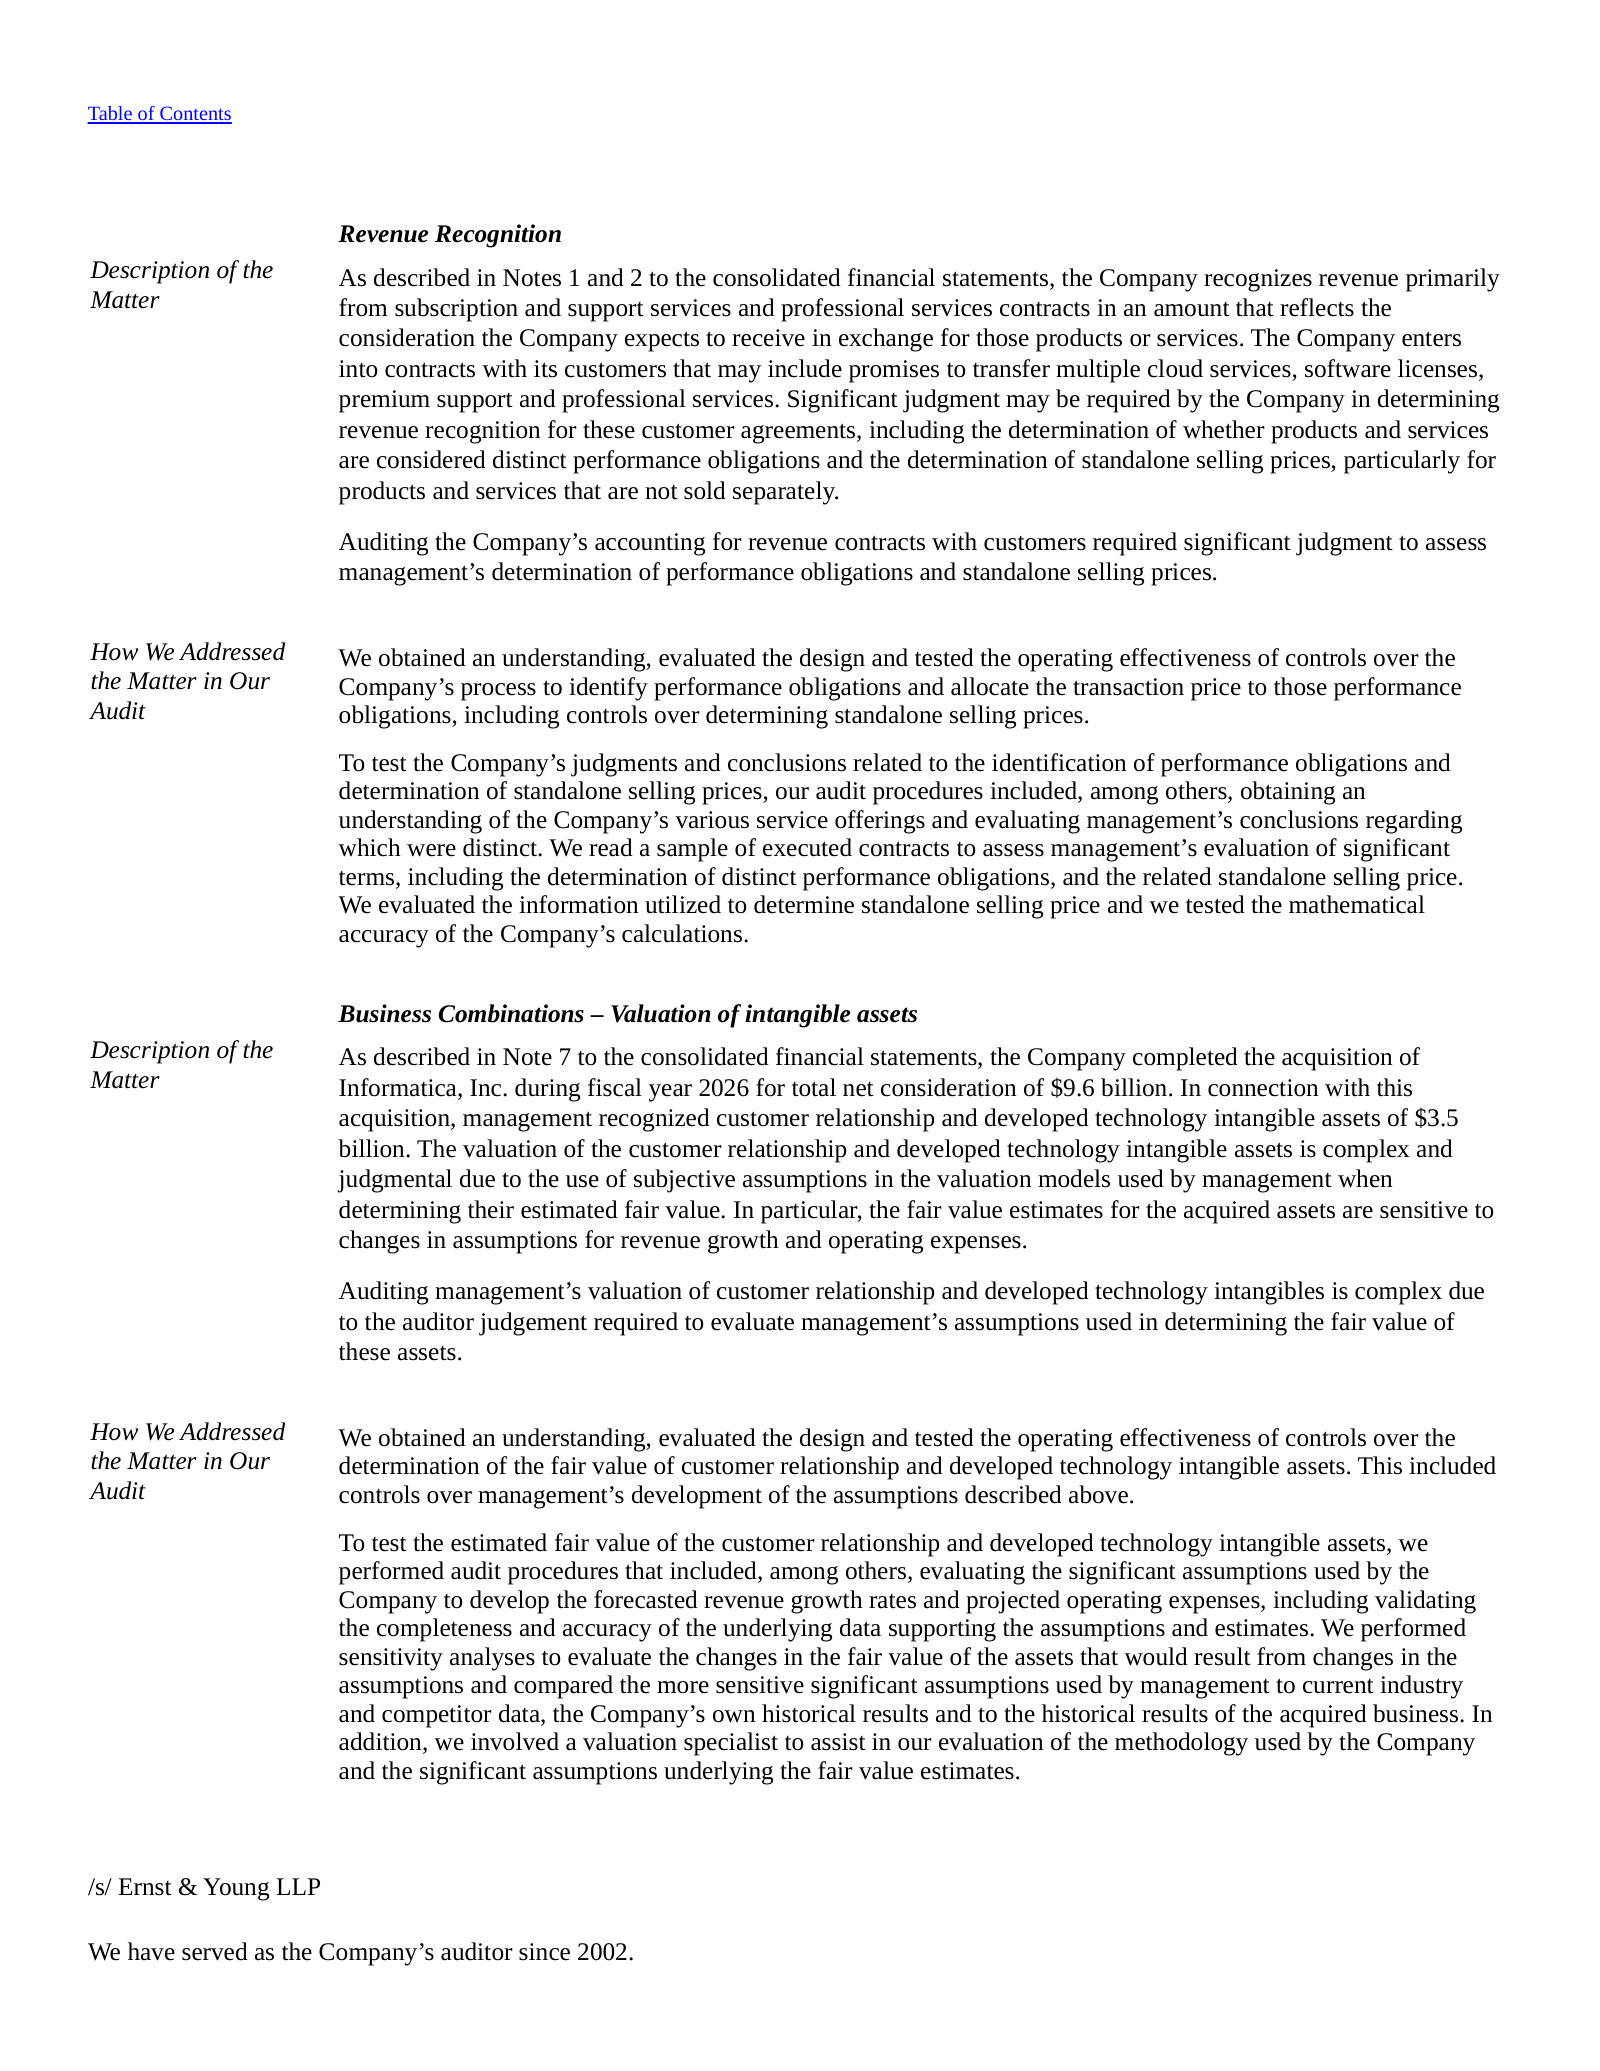
Item 8. Critical Audit Matter — Revenue Recognition — p. 79 · Read the full section →
The auditors flag revenue recognition as the critical judgment — the accounting that defines a multi-element subscription model.
Salesforce, Inc. — FY2025 Annual Report (Form 10-K) — FY2025
Included for one contrast: the same product lines a year earlier, before the FY2026 “Agentforce” rebrand of every offering. · Open the full document →
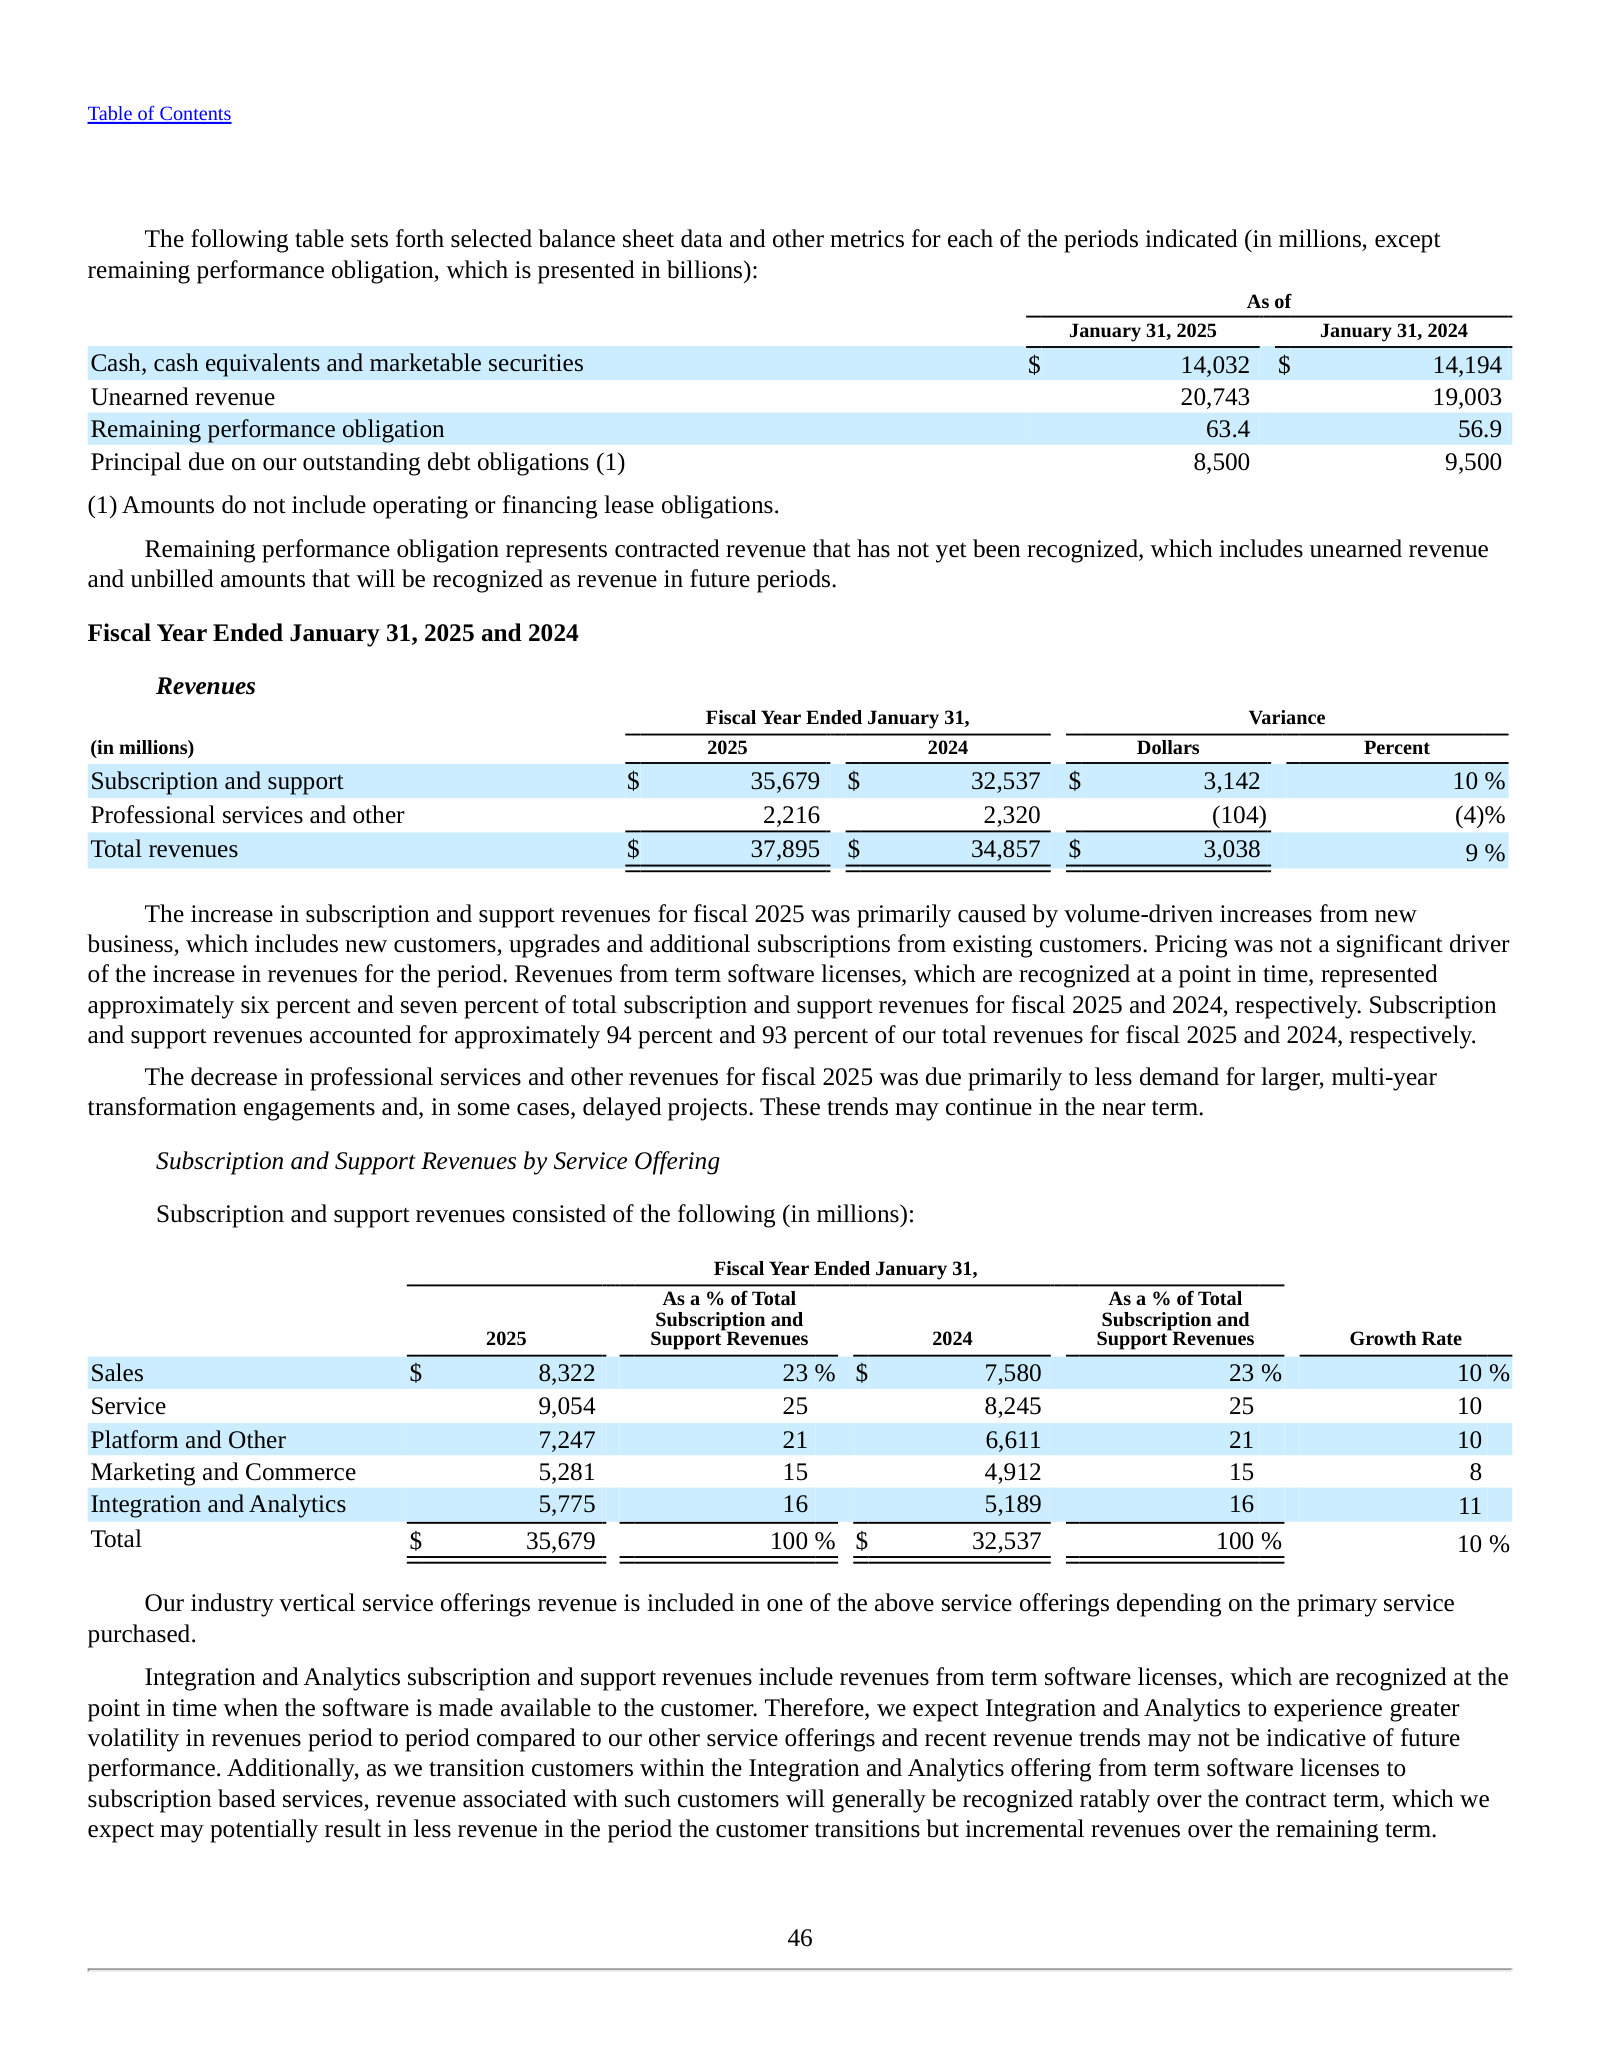
Item 7. MD&A — Subscription and Support Revenues by Service Offering — p. 67 · Read the full section →
Same dollar lines as FY2026 under the old cloud names — Sales, Service, Platform, Marketing and Commerce, Integration and Analytics.
More annual reports
Salesforce, Inc. — FY2024 Annual Report (Form 10-K) — FY2024 · 142 pages · The margin-turnaround year: operating margin jumped as restructuring and cost discipline followed activist pressure. · Open →
Salesforce, Inc. — FY2023 Annual Report (Form 10-K) — FY2023 · 102 pages · Peak-hiring aftermath: the report that set up the FY2024 restructuring and the profitability reset. · Open →
Salesforce, Inc. — FY2022 Annual Report (Form 10-K) — FY2022 · 104 pages · Post-Slack-acquisition baseline, before the AI pivot — useful anchor for the multi-year growth-to-margin story. · Open →
Source: S&P Capital IQ consensus via Xpressfeed · Generated 2026-07-22.
Street snapshot
Currency: USD · Scale: money in millions, absolute · Analyst counts shown explicitly.
| Street view | Reading | Analysts |
|---|---|---|
| Recommendation mix | Buy 34, Outperform 5, Hold 12, Underperform 2, Sell 0 | 53 |
| Consensus score | 1.66 | 53 |
| Target price | mean $241.7; median $236.0; high $475.0; low $160.0 | 53 |
Forward estimates
Currency: USD · Scale: money in millions, absolute · YoY uses the prior fiscal year from the feed; analyst count and range use the first displayed period.
| Metric | FY2027E | FY2028E | FY2029E | YoY | Analysts | Low / high |
|---|---|---|---|---|---|---|
| Revenue | $46.11bn | $50.51bn | $55.28bn | +11.0% | 48 | $45.76bn / $46.43bn |
| EBITDA | $17.91bn | $19.34bn | $20.63bn | +11.3% | 9 | $12.66bn / $20.29bn |
| EPS (GAAP) | $8.18 | $9.56 | $11.67 | +4.9% | 27 | $7.63 / $9.76 |
| EPS (normalized) | $14.13 | $15.51 | $17.95 | +12.9% | 51 | $13.22 / $15.28 |
| Free cash flow | $14.90bn | $16.38bn | $17.79bn | +5.5% | — | — |
| Gross margin | 80.7% | 80.8% | 80.7% | +0.3pt | — | — |
Estimate momentum
Currency: USD · Scale: money in millions, absolute · Point-in-time consensus; Δ90d is Now versus 90d.
| Metric | FY | 180d | 90d | 30d | Now | Δ90d |
|---|---|---|---|---|---|---|
| Revenue | FY2027 | $46.15bn | $46.14bn | $46.10bn | $46.11bn | -0.1% |
| Revenue | FY2028 | $50.61bn | $50.57bn | $50.55bn | $50.51bn | -0.1% |
| EPS (normalized) | FY2027 | $13.20 | $13.20 | $14.13 | $14.13 | +7.1% |
| EPS (normalized) | FY2028 | $15.14 | $14.93 | $15.50 | $15.51 | +3.9% |
Beat / miss record
Current sequences by metric: Revenue: 2 consecutive beats; EPS (normalized): 6 consecutive beats.
Currency: USD · Scale: money in millions, absolute · Consensus is captured before each actual first became effective.
| Quarter | Metric | Consensus | Actual | Surprise | Outcome |
|---|---|---|---|---|---|
| Q1 FY2027 | Revenue | $11.06bn | $11.13bn | +0.7% | Beat |
| Q1 FY2027 | EPS (normalized) | $3.13 | $3.88 | +24.1% | Beat |
| Q4 FY2026 | Revenue | $11.19bn | $11.20bn | +0.1% | Beat |
| Q4 FY2026 | EPS (normalized) | $3.05 | $3.81 | +24.9% | Beat |
| Q3 FY2026 | Revenue | $10.27bn | $10.26bn | -0.1% | Miss |
| Q3 FY2026 | EPS (normalized) | $2.86 | $3.25 | +13.6% | Beat |
| Q2 FY2026 | Revenue | $10.14bn | $10.24bn | +1.0% | Beat |
| Q2 FY2026 | EPS (normalized) | $2.78 | $2.91 | +4.7% | Beat |
| Q1 FY2026 | Revenue | $9.75bn | $9.83bn | +0.8% | Beat |
| Q1 FY2026 | EPS (normalized) | $2.55 | $2.58 | +1.3% | Beat |
| Q4 FY2025 | Revenue | $10.04bn | $9.99bn | -0.4% | Miss |
| Q4 FY2025 | EPS (normalized) | $2.61 | $2.78 | +6.4% | Beat |
| Q3 FY2025 | Revenue | $9.35bn | $9.44bn | +1.0% | Beat |
| Q3 FY2025 | EPS (normalized) | $2.45 | $2.41 | -1.5% | Miss |
| Q2 FY2025 | Revenue | $9.23bn | $9.32bn | +1.0% | Beat |
| Q2 FY2025 | EPS (normalized) | $2.36 | $2.56 | +8.7% | Beat |
Where the street disagrees
Currency: USD · Scale: money in millions, absolute · Spread/mean is absolute high-low divided by absolute mean.
| Metric | Period | Mean | Low–high | Spread/mean | Analysts |
|---|---|---|---|---|---|
| EBITDA | FY2029E | $20.63bn | $15.06bn–$25.20bn | 49.1% | 3 |
| Net income (GAAP) | FY2028E | $8.23bn | $6.86bn–$10.60bn | 45.4% | 33 |
| EBITDA | FY2027E | $17.91bn | $12.66bn–$20.29bn | 42.6% | 9 |
| EBITDA | FY2025A | $14.13bn | $10.07bn–$16.08bn | 42.5% | 6 |
| EPS (GAAP) | FY2028E | $9.56 | $8.12–$11.98 | 40.4% | 27 |
Visible Alpha broker models via S&P Xpressfeed · 37 brokers · 399 line items · freshest revision 2026-07-21.
Brokers model Salesforce as a steady high-single to low-double-digit grower where the headline consensus is tight and the real debate sits in forward demand and product mix. Current RPO and billings — the leading indicators — show growth that peaked around 13% and is fading toward 10%. Within the top line, only the AI-exposed Platform cloud is accelerating while Marketing & Commerce has effectively stalled. Segment coverage thins sharply beyond FY-2026 as Salesforce shifts to a new 'Agentforce apps' reporting structure.
Current RPO and billings drive the model; cRPO growth fades from ~13% to ~10%
Total billings and current RPO are the cleanest read on future subscription revenue; both keep compounding in dollars, but constant-currency cRPO growth cools from 13.5% in FY-2026 to under 10% thereafter. The cRPO growth line rests on only 5-8 brokers.
| Line | FY-2025A | FY-2026A | FY-2027E | FY-2028E | YoY | Brokers |
|---|---|---|---|---|---|---|
| Total billings | $39.43bn | $43.81bn | $48.67bn | $53.11bn | +11.1% | 33 |
| RPO - Current | $30.15bn | $34.58bn | $38.97bn | $43.06bn | +12.7% | 27 |
| Total RPO | $61.62bn | $70.74bn | $79.37bn | $84.50bn | +12.2% | 20 |
| RPO - Current - CC growth(%) | 9.8% | 13.5% | 9.7% | 9.6% | -3.8pt | 14 |
Platform is the only accelerating cloud; Marketing & Commerce has stalled
| Line | FY-2025A | FY-2026A | FY-2027E | FY-2028E | YoY | Brokers |
|---|---|---|---|---|---|---|
| Revenue - Platform and other | $7.19bn | $8.52bn | $11.19bn | $13.41bn | +31.4% | 24 |
| Revenue - Service | $9.10bn | $9.85bn | $10.58bn | $11.46bn | +7.5% | 24 |
| Revenue - Sales | $8.36bn | $9.03bn | $9.74bn | $10.30bn | +7.8% | 24 |
| Revenue - Data | $5.79bn | $6.46bn | $6.65bn | $7.35bn | +2.9% | 24 |
| Revenue - Marketing and Commerce | $5.30bn | $5.46bn | $5.54bn | $5.73bn | +1.5% | 24 |
Brokers disagree most on how big the AI-exposed Platform cloud becomes
| Line | Period | Median | Q1–Q3 | Min–max | Brokers |
|---|---|---|---|---|---|
| Revenue - Platform and other | FY-2027E | $11.19bn | $10.44bn–$11.65bn | $9.57bn–$12.73bn | 12 |
| Revenue - Platform and other | FY-2028E | $12.91bn | $11.69bn–$14.15bn | $10.34bn–$18.24bn | 12 |
| Revenue - Data | FY-2028E | $7.25bn | $6.91bn–$7.72bn | $6.21bn–$9.38bn | 12 |
Subscription gross margin is drifting lower as AI compute costs weigh
Subscription & support gross margin is modeled to slip from 85.4% in FY-2026 toward 84.9% by FY-2028 — a modest but consistent decline across 18-19 brokers, consistent with rising cost of delivery as AI features scale.
Segment, ARR and churn lines thin out beyond FY-2026
Salesforce is migrating to a new 'Agentforce apps' and 'Data 360' reporting structure, so the traditional cloud split drops from ~23 brokers in FY-2026 to 12-13 in outer years, while the new Agentforce apps line (14 brokers) exists only from FY-2027. ARR, renewal billings and churn are modeled by just 1-4 brokers and should not be read as consensus.
Headline P&L consensus, momentum and beat/miss live in the CapIQ tab.
Source: S&P Capital IQ transcripts via Xpressfeed · latest indexed call 2026-05-27 · generated 2026-07-22.
Latest call digest
Salesforce, Inc., Q1 2027 Earnings Call, May 27, 2026 · 2026-05-27T21:00:00
Q1 FY2027 — reported May 27, 2026 (second video earnings call). Prepared remarks led with record headline metrics and two customer showcases (PenFed, UCLA Health): revenue of $11.13 billion (up 13%, 12% in constant currency), cRPO of $33.6 billion (up ~14%, 13% cc), non-GAAP operating margin of 34.8% (up 250 bps) and $6.7 billion in operating cash flow. Management framed the quarter around Agentforce ARR crossing $1 billion, $3.4 billion in combined AI and data ARR, 28.6 trillion tokens and 3.8 billion agentic work units, 98 deals over $1 million, the new 'Headless 360' surface strategy, and a record $25 billion accelerated share repurchase (half of the $50 billion authorization) that cut diluted share count ~10% year-over-year.
The Q&A was more pointed than the prepared script. The hardest exchange came from Morgan Stanley, which noted cRPO has merely matched guidance for two straight quarters while bookings appear to lag the Agentforce KPIs, and asked what underpins the promised second-half organic subscription reacceleration; management leaned on net-new AOV outpacing AOV and pipeline strength rather than cRPO, which it conceded was in line. Analysts also pressed on translating usage (tokens/AWUs) into revenue and gross-margin durability, and on Headless 360's downside/value-abstraction risk.
Guidance actually stated: FY27 revenue midpoint raised to $45.9-$46.2 billion with ~11% cc subscription growth; non-GAAP operating margin reiterated at 34.3% while GAAP margin was cut to 20.6% on higher restructuring; operating and free cash flow growth cut to 4-5% on an ~5-point headwind from ASR-related debt; and Q2 revenue of $11.27-$11.35 billion (~10% cc). Persistent soft spots called out: Marketing, Commerce and Tableau.
Participant coverage from the latest call.
| Group | Participants | Count |
|---|---|---|
| Management | Operator; Michael Spencer — Executive Vice President of Investor Relations, Salesforce, Inc.; Marc Benioff — Co-Founder, Chairman & CEO, Salesforce, Inc.; James Schenck — President & CEO, Pentagon Federal Credit Union; Michael Burke; Pallavi Mynampati; Robin Washington — President, Chief Operating & Financial Officer and Director, Salesforce, Inc.; Miguel Milano — President & Chief Revenue Officer, Salesforce, Inc.; Patrick Stokes — President & Chief Marketing Officer, Salesforce, Inc.; Srinivas Tallapragada — President, Chief Engineering & Customer Success Officer, Salesforce, Inc. | 10 |
| Analysts | Brent Thill — MD & Tech Sector Equity Analyst, Jefferies LLC, Research Division; Keith Weiss — Equity Analyst, Morgan Stanley, Research Division; Gabriela Borges — Analyst, Goldman Sachs Group, Inc., Research Division; Brad Zelnick — MD of Software Equity Research & Senior US Software Research Analyst, Deutsche Bank AG, Research Division; S. Kirk Materne — Senior MD & Fundamental Research Analyst, Evercore ISI Institutional Equities, Research Division | 5 |
Curated latest-call exchanges; one row per analyst topic.
| Analyst | Firm | Topic | What changed in Q&A |
|---|---|---|---|
| Brent Thill | Jefferies | AI-led transformation; customer-pipeline signals | Open-ended lead-off; Benioff pivoted to internal service autonomy and Agentforce replacing Salesforce search rather than new disclosed metrics. |
| Keith Weiss | Morgan Stanley | Basis for back-half organic subscription reacceleration despite in-line cRPO | Hardest exchange: flagged two quarters of in-line cRPO, lagging bookings, and Tableau/Commerce drag; management answered with net-new-AOV-over-AOV and pipeline, conceding cRPO was in line. |
| Gabriela Borges | Goldman Sachs | Headless 360 monetization and downside/value-abstraction risk | Asked how Salesforce protects the downside if customers or rivals abstract value out; answer stressed openness and upside, with monetization still being worked out with customers and partners. |
| Brad Zelnick | Deutsche Bank | Translating AWU/token usage to revenue; gross-margin durability | Management tied monetization to top-10 AWU customers spending ~1.5x more and framed flat engineering headcount plus token cost absorbed into margin. |
| S. Kirk Materne | Evercore ISI | Slack as a gateway for broader agentic adoption / network effects | Friendly close; management framed Slack as the work operating system with AWUs up ~350% QoQ and a path to becoming a $10 billion cloud. |
Theme tracker
Themes are curator-classified across supplied calls.
| Theme | Status | Quarters mentioned | Read-through |
|---|---|---|---|
| Agentforce / the 'agentic enterprise' | persisted | Q3 2025, Q4 2025, Q1 2026, Q2 2026, Q3 2026, Q4 2026, Q1 2027 | From launch (Dec 2024) it has been the central narrative in every subsequent call, with ARR scaling to over $1 billion by Q1 FY27. |
| Data Cloud / Data 360 and the data foundation (incl. Informatica, MuleSoft) | persisted | Q2 2024, Q4 2024, Q1 2025, Q2 2025, Q3 2025, Q4 2025, Q1 2026, Q2 2026, Q3 2026, Q4 2026, Q1 2027 | Positioned as the prerequisite 'context' for accurate agents throughout; the $8B Informatica deal (announced Q1 FY26, closed Q3 FY26) extended the theme. |
| Slack as a growth engine / work operating system | emerged | Q3 2026, Q4 2026, Q1 2027 | Long owned but only recently reframed as a headline growth driver (Slackbot, ~half of $1M+ wins, AWUs up ~350% QoQ). |
| 'Measured buying' / macro-caution language | dropped | Q2 2024, Q4 2024, Q1 2025, Q2 2025 | A dominant framing across FY24-FY25 prepared remarks; it fades from later calls as the Agentforce growth story takes over. The disappearance itself is signal that management no longer leads with demand caution. |
| Pricing model evolution - consumption, Flex Credits, AELAs, premium SKUs | emerged | Q1 2026, Q2 2026, Q3 2026, Q4 2026, Q1 2027 | Consumption/Flex Credits and Agentforce enterprise license agreements appear from FY26 onward as management works out how to monetize agents beyond seats. |
| Escalating capital return (buybacks, dividend, $25B ASR) | persisted | Q4 2024, Q1 2025, Q2 2025, Q3 2025, Q4 2025, Q1 2026, Q2 2026, Q3 2026, Q4 2026, Q1 2027 | Dividend initiated FY25, repeated buyback expansions, a $50B authorization, and a record $25B accelerated repurchase in Q1 FY27. |
| Headless 360 (new monetizable surface strategy) | emerged | Q1 2027 | Named for the first time in Q1 FY27 (launched at TDX in March) and positioned as the 'next leg' of the path to FY30; monetization still to be defined. |
| Committed second-half FY27 / double-digit revenue reacceleration | persisted | Q1 2026, Q2 2026, Q3 2026, Q4 2026, Q1 2027 | The reacceleration pledge (Investor Day: 12-18 months; then H2 FY27) recurs every call and remains the key unproven commitment. |
Guidance ledger
Quotes, calls, and speakers are source-verified; outcomes are curator-classified.
| Verbatim guidance | Call | Speaker | Curator outcome | Outcome note |
|---|---|---|---|---|
| “raising our fiscal year '26 guidance by $400 million to $41.3 billion at the high end of the range” | Salesforce, Inc., Q1 2026 Earnings Call, May 28, 2025 · 2025-05-28T21:00:00 | Marc Benioff | kept | FY26 closed at $41.5 billion in revenue (reported on the Q4 FY26 call), above this raised guide, aided by the Informatica close. |
| “We are narrowing our fiscal year '26 revenue guidance on an organic basis to $41.15 billion to $41.25 billion” | Salesforce, Inc., Q3 2026 Earnings Call, Dec 03, 2025 · 2025-12-03T22:00:00 | Robin Washington | kept | FY26 total revenue landed at $41.5 billion (including Informatica), consistent with this organic range plus the acquisition contribution. |
| “we remain on track to reaccelerate revenue in 12 to 18 months” | Salesforce, Inc., Q3 2026 Earnings Call, Dec 03, 2025 · 2025-12-03T22:00:00 | Robin Washington | pending | Reaffirmed as a second-half FY27 organic reacceleration on the Q1 FY27 call; not yet realized in reported results. |
| “we're updating our fiscal year '30 revenue target to $63 billion” | Salesforce, Inc., Q4 2026 Earnings Call, Feb 25, 2026 · 2026-02-25T22:00:00 | Marc Benioff | pending | Long-dated FY30 framework; the supplied call history does not yet confirm or refute it. |
| “We are raising the midpoint of our FY '27 revenue guidance to $45.9 billion to $46.2 billion” | Salesforce, Inc., Q1 2027 Earnings Call, May 27, 2026 · 2026-05-27T21:00:00 | Robin Washington | pending | FY27 is in progress; no later call in the supplied history reports the outcome. |
| “We expect Q2 revenue of $11.27 billion to $11.35 billion, growth of approximately 10% in constant currency” | Salesforce, Inc., Q1 2027 Earnings Call, May 27, 2026 · 2026-05-27T21:00:00 | Robin Washington | pending | Q2 FY27 falls after the latest call in the supplied history. |
Q&A pressure map
Question counts and firms are curator tallies; analyst coverage shown above.
| Topic | Questions | Firms | Pressure / response |
|---|---|---|---|
| Is generative AI disrupting the SaaS application layer (build-your-own vs. buy)? | 4 | Goldman Sachs, Morgan Stanley | Recurring across FY26 calls (Kash Rangan and Keith Weiss); management consistently reframes agents as an extension of, not a replacement for, its apps + data + workflow moat. |
| cRPO/bookings not accelerating despite strong Agentforce KPIs; confidence in H2 reacceleration | 3 | Morgan Stanley, Barclays | Pressed on the Q1 FY27 and Q4 FY26 calls; management answers by pointing to net-new AOV outpacing AOV and pipeline rather than cRPO, which it acknowledges has been in line. |
| Translating Agentforce usage (AWUs / tokens) into revenue and holding gross margin | 3 | Deutsche Bank, Goldman Sachs, Evercore ISI | Analysts repeatedly ask how usage converts to dollars; management leans on top-10 AWU customers spending ~1.5x more and consumption over time rather than a direct usage-to-revenue bridge. |
| Capital allocation - buyback scale vs. M&A | 2 | Jefferies | Brent Thill pressed on successive buyback expansions; management frames a buyback/dividend/M&A/debt 'trinity' and disciplined, accretion-focused M&A. |
Language shifts
Only language evidence verified against the referenced component is shown.
| Observation | Verbatim evidence | Call ID | Component |
|---|---|---|---|
| Management now openly names and engages the 'SaaSpocalypse' bear case it previously only alluded to, arguing AI apps improve rather than replace its products. | “you've heard the narrative on the SaaSpocalypse” | 1999230054 | 12 |
| A rare hedge on the reacceleration commitment: Milano conceded the 12-18-month pledge carried real execution risk even as he claimed it is being met. | “we're good professionals, but we're not magicians” | 1999230054 | 66 |
| Introduction of token-throughput as a new confidence metric (3.2T tokens in Q3 FY26, scaling to 28.6T by Q1 FY27) to evidence real usage. | “Agentforce has processed more than 3.2 trillion tokens” | 1969075553 | 2 |
| Caution around Tableau intensified, moving from earlier 'on-prem timing' framing to explicit softness in both bookings and renewals. | “increased softness in Tableau bookings and renewals” | 1999230054 | 34 |
The call history shows Salesforce successfully swapping a multi-year 'measured buying' macro-caution narrative for an Agentforce-led growth story, with usage metrics and capital return scaling quickly. The unresolved question the transcripts keep surfacing is conversion: cRPO and bookings have tracked in line while Tableau, Marketing and Commerce stay soft, so the promised second-half FY27 organic reacceleration remains the pledge on which the current debate turns.
Competitors describe Salesforce, Inc.'s market in their own filings and calls. These verified passages and visual pages show where their strategies meet, using source documents preserved in Sources.
ServiceNow (NOW)
The most direct strategic collision with Salesforce's core: ServiceNow is pushing its AI-agent platform (Now Assist) and a new CRM/sales-and-order-management front office straight at Salesforce's CRM franchise and Agentforce, arguing on its own calls that agentic AI makes the traditional CRM screen obsolete.
ServiceNow's CEO frames agentic AI as making the traditional CRM screen obsolete and positions ServiceNow's move into sales/order management and CRM.
William McDermott, Chairman and CEO: The CRM opportunity for ServiceNow is massive. According to industry experts, agentic AI represents a seismic shift that could render traditional CRM obsolete. By the end of this decade, enterprises will adopt systems of action driven by autonomous front-end agents. The future isn't a CRM screen; it's an omnipresent AI agent embedded in everyday tools. With our sales and order management solution and our acquisition of Logik.ai, we're not just entering CRM; we're reimagining it now.
p. 1 · Read in context →
ServiceNow's stated Now Assist AI-agent traction: ACV surpassing $600M and doubling year over year, with 35 deals over $1M in the quarter.
William McDermott, Chairman and CEO: Now Assist NNACV outperformed expectations in Q4 and surpassed $600,000,000 in ACV. In Q4, Now Assist NNACV more than doubled year over year. We had 35 deals over $1,000,000 in Q4 alone. Our AI control tower deal volume nearly tripled.
p. 2 · Read in context →
ServiceNow's stated CRM/industry-workflow deal traction (16 of its top 20 deals) and Now Assist tracking toward a $1B ACV target.
Gina Mastantuono, President and CFO: CRM and industry workflows were in 16 of our top 20 deals with 16 over $1 million, driven by strength in CPQ and sales and order management. […] Now Assist continues to outperform expectations, putting it on a trajectory to exceed our $1 billion target for 2026.
p. 5 · Read in context →
Adobe (ADBE)
Adobe's Digital Experience business competes with Salesforce Marketing Cloud, Data Cloud and Agentforce: it markets the Adobe Experience Platform as a leading customer data platform and is racing out AI agents (Agent Orchestrator, CX Enterprise) for the same marketer buyer. Exhibits are limited to its Digital Experience segment, not Creative or Document Cloud.
Adobe's stated claim to lead customer-experience management and the 'customer data platform' category, serving 99 of the Fortune 100, with AEP-agent scale metrics.
Anil Chakravarthy, President, Digital Experience: Adobe pioneered the category of customer experience management. Enterprises around the world rely on our software to identify prospects, acquire new customers, engage and delight them with personalized experiences and grow customer lifetime value. We are the leading provider of content management systems for websites and mobile apps and the leading customer data platform that serves as the foundation in enterprises for digital customer engagement. We serve 99 of the Fortune 100 and are the digital platform of choice for Chief Marketing Officers and Chief Digital Officers for their ongoing campaigns and for major marketing moments like the Olympics and Super Bowl. […] In Q1, we introduced new AEP agents along with expanded agent orchestrator capabilities now available to all AEP customers via a try-and-buy program. The scale of our platform has grown to over 35 trillion segment evaluations and more than 70 billion profile activations per day.
p. 4 · Read in context →
Adobe's stated market-share gains in AI marketing automation and its launch of CX Enterprise, an end-to-end agentic-AI system spanning the customer lifecycle.
Anil Chakravarthy, President, Digital Experience: The opportunity for AI-powered marketing automation and customer experience orchestration is large and growing, and we are continuing to gain market share and expand our leadership. […] Over 80% of AEP and AEM customers are now using agentic capabilities built into our products. […] At Adobe Summit in April, where we hosted over 14 thousand in person attendees, we launched Adobe CX Enterprise, a new end-to-end agentic AI system that simplifies how enterprises manage their entire customer life cycle from acquiring and engaging prospects to driving conversion and lasting loyalty. Adobe CX Enterprise brings together AI agents, agent skills, and model context protocol endpoints with an intelligence and governance layer to deliver reliable and auditable agentic workflows that enable highly personalized, differentiated customer experiences.
p. 4 · Read in context →
Adobe's 10-K claim to be a 'market leader' in the Digital Experience category, integrating Experience Cloud apps on the Experience Platform with embedded AI.
We are a market leader in the fast-growing category addressed by our Digital Experience segment. The Adobe Experience Cloud apps and services are designed to manage customer journeys, enable personalized experiences at scale and deliver intelligence for businesses of any size in any industry. Our differentiation and competitive advantage are strengthened by our ability to use the Adobe Experience Platform to integrate our comprehensive set of solutions and our ability to embed AI into our product portfolio, such as with our new Adobe Experience Platform AI Assistant, a generative AI-powered conversational interface designed to help customers automate workflows and generate new audiences and journeys.
p. 68 · Read in context →
Snowflake (SNOW)
Snowflake is the pure-play enterprise data platform whose thesis - own the governed single source of truth that AI runs on - directly contests Salesforce Data Cloud. It is also a coopetitor: it names Salesforce as a zero-copy data-sharing partner while positioning itself as the neutral layer that unifies Salesforce's data alongside everyone else's.
Snowflake's CEO describes zero-copy data-sharing agreements with Salesforce, ServiceNow, SAP and Workday, and casts Snowflake as the neutral layer unifying that data for agents.
Sridhar Ramaswamy, CEO (answering Barclays): Zero copy generally comes up in the context of SaaS vendors who are under a lot of pressure from their customers to share data. Many of them are busy creating data products on top of the data as a way to monetize, and zero copy or sometimes bidirectional data sharing agreements come up in that context as a faster, more efficient way for people to share data with each other. We see these as a win-win. We have these agreements with ServiceNow, Salesforce, SAP with the recent partnership, as well as Workday. […] I can tell you from personal experience that I'm not thinking when I'm looking at my sales data agent about whether this data comes from Workday or from Salesforce or from our own systems. I can focus on the logic of what needs to get done.
p. 7 · Read in context →
Snowflake's CEO argues the AI winners will be whoever owns the governed 'single source of truth' for enterprises - the data-foundation role Salesforce Data Cloud also claims.
Sridhar Ramaswamy, CEO: I believe it's important to take a step back and assess the overall impact of AI on software. We dedicate considerable time to this area and our perspective is that the successful companies will be those that deliver a single source of truth for enterprises. No AI model can be effective if there are multiple conflicting sources of truth. Additionally, having integrated security, auditability, trust, and governance regarding data access is essential. While it is important to utilize top models, there are currently at least three or four leading model providers, and we collaborate with all of them. Our unique advantage, which has been present since the company's inception, is our ability to combine all these elements into a user-friendly product.
p. 10 · Read in context →
Snowflake's 10-K scale and retention metrics: 13,328 customers, 790 of the Forbes Global 2000, 125% net revenue retention and $4.7B revenue - the incumbency Data Cloud contends with.
As of January 31, 2026, we had 13,328 total customers, increasing from 10,996 customers as of January 31, 2025. As of January 31, 2026, our customers included 790 of the Forbes Global 2000, based on the 2025 Forbes Global 2000 list, and those customers contributed approximately 43% of our revenue for the fiscal year ended January 31, 2026. […] As our customers experience the benefits of our platform, they typically expand their usage significantly, as evidenced by our net revenue retention rate, which was 125% as of January 31, 2026. […] For the fiscal years ended January 31, 2026, 2025, and 2024, our revenue was $4.7 billion, $3.6 billion, and $2.8 billion, respectively, representing year-over-year growth of 29% in each period.
p. 7 · Read in context →
Shopify (SHOP)
Shopify competes with Salesforce Commerce Cloud, and increasingly at the enterprise and B2B end where it says it is winning brands off larger legacy commerce platforms. It also names Salesforce as a fellow participant in the commerce protocol it claims to have founded.
Shopify's stated claim to be winning enterprise commerce deals against custom-built solutions and larger existing enterprise platforms - the segment Salesforce Commerce Cloud serves.
Harley Finkelstein, President: The enterprise is transitioning to Shopify. As I mentioned last quarter, some of the largest companies in their industries are joining us. […] Many large enterprises, particularly those that have existed for decades, are discussing in their boardrooms how to choose a futureproof platform to embrace the future of commerce, and they are increasingly looking to Shopify. We are succeeding in sectors like food, manufacturing, education, and automotive, where we previously hadn't focused, and we are winning against both custom-built solutions and larger existing enterprise platforms. The quality and value of Shopify's enterprise product are unparalleled.
p. 10 · Read in context →
Shopify names Salesforce among the participants in its Universal Commerce Protocol council while positioning itself as the founding member and standard-setter.
Harley Finkelstein, President: The partnership is deepening. Stripe recently joined our UCP Tech Council alongside Amazon, Meta, Microsoft and Salesforce; we were the founding member. And just to be clear, UCP is now becoming the industry standard and Shopify helped build it. It is the only standard that covers the full commerce journey end to-end.
p. 12 · Read in context →
Shopify's 10-K notes that the majority of its GMV comes from merchants on its Shopify Plus plan and enterprise offerings - the higher tier that overlaps Salesforce Commerce Cloud.
While most merchants subscribe to our Basic and Grow plans, the majority of our gross merchandise volume ("GMV") has been generated from merchants subscribing to our Shopify Plus plan and enterprise offerings.
p. 8 · Read in context →
More peer documents
NOW_annual_report_FY2025 — 120 pages · ServiceNow's 10-K risk factors concede it is competing into new and adjacent markets against cloud and AI-native application vendors - the category that includes Salesforce. · Open →
Q3_FY2025 — 13 pages · Earlier-quarter call with more Now Assist and CRM/CPQ front-office commentary tracking the ramp against Agentforce. · Open →
ADBE_annual_report_FY2025 — 144 pages · Adobe's latest 10-K describes Agent Orchestrator, Brand Concierge and Real-Time CDP - its direct product analogs to Agentforce and Data Cloud. · Open →
Q3_FY2025 — 13 pages · Chakravarthy calls Adobe the 'largest software provider in our category' and launches AEP Agent Orchestrator; Digital Experience revenue detail. · Open →
Q2_FY2026 — 13 pages · CEO answers a direct question on the competitive landscape, staking the 'best AI data platform' claim against Databricks, hyperscalers and Palantir. · Open →
SNOW_annual_report_FY2025 — 144 pages · Prior-year 10-K with the parallel customer and Forbes Global 2000 metrics for a year-over-year read on Snowflake's enterprise footprint. · Open →
Q4_FY2025 — 1 page · Full-year call with enterprise, B2B and offline momentum plus GMV share-of-retail framing relevant to Commerce Cloud. · Open →
SHOP_annual_report_FY2024 — 198 pages · Prior-year 10-K describing the Plus/enterprise commerce offering and merchant base for a baseline against the FY2025 filing. · Open →
The answer
Does not fit the framework (P1 not met); contested: P2, P5
Salesforce clears the universe and trips no exclusion, but the year-10 durability gate (P1) does not clear with the very-high conviction it demands, and that gate is decisive on its own — nothing offsets it. Confidence is low: a load-bearing criterion was contested (P5, the temporary-versus-permanent diagnosis) and its probability spread of 0.26 exceeded the 0.25 threshold, while the consistency criterion (P2) split across model families. No watchlist-only flag applies; long-dated options exist. The framework's own rule governs: any proper doubt at the gate resolves to does not fit.
Universe and exclusions
The screen is clean, and it is worth saying plainly what "clean" means here: nothing in the universe or exclusion set blocks the name, so the case turns entirely on the pillars below.
Both universe lines are met. Salesforce is a US-domiciled, Delaware-incorporated common stock listed on the NYSE under ticker CRM — not an ADR, not a Chinese issuer [1]. Market capitalization is roughly $163B (956M shares at $170.77, 2026-07-17), about sixteen times the $10B floor, and even the June-2026 trough of $150.12 (~$143B) stayed far above it.
Every hard exclusion was checked and none hit:
- Auto-OEM (X1): not triggered — this is cloud CRM software at a 77.7% gross margin, not vehicle manufacturing [2].
- Promotional CEO (X2): not triggered — Benioff's register is promotional, but the checkable promises delivered (the 30% non-GAAP operating-margin target was hit at 30.5% in FY2024 and 33% in FY2025; the FY2026 revenue guide of $41.0–41.3B closed at $41.5B), and he holds ~22.8M shares (~2.8%, ~$3.9B). The counter-fact in the same breath: one large forward promise — a return to double-digit revenue growth in the second half of FY2027 — remains unproven.
- Structural decline (X3): not triggered — revenue has not declined in any of the last ten years, let alone high-single-digit for three consecutive years; the counter-fact is that growth has decelerated from 28.7% (FY2020) to 9.6% (FY2026).
- Market darling / extreme multiple-to-sales (X4): not triggered — the stock trades at ~3.9x sales and ~21.9x trailing GAAP earnings after a 59.2% drawdown; the counter-fact is that the sell side still rates it a consensus buy with a mean target ~40% above spot [3].
- China dependence (S1): immaterial — total Asia Pacific revenue is 10.4% of the total, China is not separately disclosed, and renminbi is not among the currencies Salesforce flags for FX exposure (per the FY2026 segment and market-risk disclosures; the exact China sub-portion is not separately reported).
Pattern match
Of the framework's four recognition setups — cyclicals at the bottom, high dividend plus high FCF yield, healthcare/insurance forecasting errors, and quality tech monopolies/duopolies on a fear dip — Salesforce most resembles the fourth in shape but fails its structural check.
The fear-dip shape is real: a 59.2% peak-to-trough fall on a specific, testable narrative (AI agents cannibalizing the seat-based model), a capitulation volume spike of 3.5x the pre-peak median, and a company buying back its own stock at prices management called "low." What the pattern also requires — a monopoly or duopoly market structure — is absent. The company's own 10-K calls its market "highly competitive, rapidly evolving and fragmented, and subject to changing technology with low barriers to entry" [4]. The lead rests on switching costs and scale, which the framework values below the regulator-gated, capital-heavy structures it prizes. The setup carries the fear the framework hunts but not the structure it requires.
The pillar ledger
Reference lines throughout — where the company sits against the framework's own bars, with the deciding arithmetic. Full treatment sits on the linked evidence tab.
Year-10 durability gate — P1 (not met; the decisive result)
Here is the decisive point. The gate asks whether year-10 revenue and free cash flow will be higher than today with very high conviction, and it is binary by construction: any proper doubt resolves to does not fit. All four jury seats returned not met (trimmed-mean probability 0.635, spread 0.08, agreement across both model families). The base rates favor a higher year-10: revenue rose in every one of the last ten fiscal years ($8,437M FY2017 to $41,525M FY2026) and reported free cash flow rose in every one ($1,698M to $14,402M) [5], the structural-decline disqualifier is not tripped, and Salesforce is the #1 CRM provider globally [6]. The counter-fact sits in the same treatment and is what fails the gate: the conviction sources the framework rewards do not apply. There is no monopoly/duopoly structure, no regulatory entry barrier, and capital intensity is negligible (capex $594M / revenue $41,525M = 1.43%), so the moat is switching costs — execution-adjacent, which the framework explicitly says is not a year-10 moat. And the 10-K itself concedes a live, unresolved threat: "New AI offerings may disrupt our service offerings or transform workforce needs and negatively impact demand for our offerings" [7]. Rising history plus an unresolved doubt is exactly the case the binary gate resolves against. Full treatment: Durability.
FCF consistency — P2 (contested)
Reported free cash flow rose every year for a decade with zero negative episodes, which meets the consistency test on a reported basis — two claude seats voted met. The two codex seats returned cannot-determine, because the framework's actual metric is adjusted-FCF stability, and that series is not computable: stock-based compensation was absent from the structured cash-flow feed for all of FY2017–FY2026, so the rolling five-year adjusted series could not be built [8]. The split is 2 met / 2 cannot-determine, across families — the aggregate is contested. Full treatment: Durability, Yield.
Dislocation and yield — P3a, P3b, P3c, P3d
Entry trigger (P3a, not met). The 59.2% drawdown is genuine, but it was not driven by the framework's canonical short-term earnings cut. Every recent quarter beat, forward consensus rose, and the fall is a multiple de-rating on decelerating growth and AI-disruption fear. Two seats scored not met; the aggregate is not met. Full treatment: Dislocation.
Fear gauge (P3b, met). Volume spiked to 3.5x the pre-peak median in the peak-to-trough leg and clustered at the bottom (a 55.4M-share session on 2026-06-18, four days before the low) — emotion-driven capitulation, confirmed by all four seats. The counter-fact: the spike concentrated in the final leg, so it validates the trough, not the whole slide. Full treatment: Dislocation.
Yield versus the bar (P3c, not met). On the framework's adjusted basis — free cash flow less stock-based compensation less the five-year average of acquisition spend — the yield computes to 3.3% (FY2026 adjusted FCF $5,413M on a $163,256M cap), roughly 470 bps short of the 8–9% fortress bar. Even the charitable stock-comp-only version is 6.7%, still below 8%. The counter-fact: reported FCF yield is 8.8% and would appear to clear the bar; the gap is entirely the SBC-and-M&A adjustment for a serial acquirer [9]. Full treatment: Yield.
Forward path (P3d, not met). Reversion above the 8% adjusted bar within one to three years is roughly 20–25% likely (trimmed-mean probability 0.22, spread 0.01, both families agree). Consensus reported FCF yield reaches ~10.9% by FY2029, but net of ~$4B SBC and the ~$5.5B five-year M&A charge the adjusted forward yield is only ~5.1% (8.4% if acquisitions cease) — clearing the bar depends on the serial-acquisition run-rate collapsing. Full treatment: Yield.
Balance sheet and self-help — P4a, P4b, P4c
Can it outlast the problem (P4a, met). Net debt is a fraction of one year's free cash flow — roughly $4.8B (including marketable securities) against $14.4B of FY2026 FCF, or 0.34x — with a single trivial near-term maturity (the $4.0B Informatica 364-day facility) and a $5.0B undrawn revolver [10]. The counter-fact in the same breath: in FY2026 the company drew $6.0B of new debt to run an $8.1B acquisition and a $12.6B buyback at once, so the constraint on repurchases is acquisition appetite, not solvency [11]. Full treatment: Self-Help.
The repurchase engine (P4b, not met). The buyback is executed and large but not yet a powerful share-retirement engine: SBC of ~$3.5B a year reissues roughly two-thirds of what is bought, so across FY2024–FY2026 gross repurchases of 116M shares netted to only a 41M-share reduction (997M to 956M), about 1.4% a year, and fit_features still classes the multi-year trend as rising (700M in FY2017 to 956M in FY2026). At a 10% adjusted yield the framework's flywheel would retire ~10% a year; the delivered rate is ~1.4% [12]. The counter-fact: the count has now fallen three years running and a $50B authorization plus a $25B accelerated repurchase at the depressed price show intent to accelerate. The absurdity check does not trigger — at today's price it takes ~11 years of reported FCF (or ~15 net of SBC) to retire the float, not the ~3 years that flags an impossible price. Full treatment: Self-Help.
Dividend (P4c, not applicable). The dividend is immaterial to the case — a ~1.0% yield covered ~9x by free cash flow, initiated only in FY2025, with no downturn record to test.
Diagnosis — P5 (contested)
The temporary-versus-permanent question is the trial's, not this tab's, and the blind panel returned it contested. The probability the impairment is temporary is 0.62, with seats at 0.62, 0.42 and 0.68 (spread 0.26) and order-stability holding (temporary-first mean 0.62 versus permanent-first 0.55, gap 0.07). The temporary reading: the price destroyed ~$196B (-54.6%) of market cap while the near-term cash hit was near zero — FCF grew ~16% and forward consensus held flat-to-up — so a reverse-DCF at a 9% discount rate implies the current price embeds only ~0% perpetual FCF growth, versus ~5.5% at the 2024 peak. The permanent reading, carried in the same breath: that ~0% embedded growth is arithmetically supportable for a business whose growth has structurally reset to high single digits and whose recent re-acceleration was "bolstered by the acquisition of Informatica" plus ~2 points of FX [13], with Agentforce Apps up only 9% [14]. The gap is nearly the whole drawdown under one reading and closes under the other; the panel did not resolve it. Full treatment: Damage Math.
Instrument context — I1 (not verifiable)
Long-dated listed options exist (January 2027 and January 2028 LEAPS, the latter listed 2025-09-15, ~18 months out as of July 2026) with deep single-name liquidity, and 30-day implied volatility reads ~45–50% — the upper edge of the framework's acceptable band, not the elevated 60–70 zone. Verdict: not verifiable, because that evidence is web-sourced and cannot be pinned to a corpus page (local data confirms only 37.9% 30-day realized volatility). The framework's watchlist-only case — no qualifying long-dated options — does not apply; options exist. Stated as a framework fact, never as advice. Full treatment: Clock.
What a three-fold return would require
The framework's target test prices the equity at its adjusted-FCF bar on normalized adjusted free cash flow, then measures the distance consensus would have to travel. That arithmetic is unavailable in this run: the tally records the re-rating math as null because the applicable bar or normalized adjusted FCF is missing — stock-based compensation was absent from the structured feed, so the deterministic adjusted-FCF series (and the yield baseline it anchors) could not be computed. The re-rating price target therefore cannot be stated without improvising the figure, which the framework forbids.
What can be stated is the base-rate context from this name's own history, per the Clock tab. Salesforce's one directly comparable episode — a company-specific 55%+ multiple de-rate (2021–22, -58.6% over 403 days) — took roughly 28 months to round-trip. The deeper 2008 drawdown (-70.5%) round-tripped in ~18 months but was a market-wide crash. The name has never round-tripped a 55%+ company-specific de-rate inside 18 months, so a full recovery on the framework's 18-month instrument horizon runs against its own base rate; partial re-recognition is the more supportable expectation.
Contested and undetermined
Two criteria are contested; none were left cannot-determine at the aggregate level.
- P2 (FCF consistency) — contested. Reported FCF rose 10/10 years with no negative episode (met), but the framework's adjusted-FCF stability series is not computable because SBC was absent from the feed (cannot-determine). Vote split: 2 met (claude) / 2 cannot-determine (codex); cross-family agreement absent.
- P5 (diagnosis) — contested. The panel split 0.62 / 0.42 / 0.68 on the probability the impairment is temporary; the spread of 0.26 drives the low confidence tier and leaves the temporary-versus-permanent question formally unresolved.
Provenance
| Item | Result |
|---|---|
| Jury composition | 4 seats — 2 Model Family A (masked seat drawn from this family), 2 Model Family B |
| Families / agreement | Two families; P1 gate agreed across both (not met, spread 0.08); P2 and P5 split across families |
| Trial order-stability | temporary-first mean 0.62 vs permanent-first 0.55; gap 0.07 (stable) |
| Name-mask probe | Every gate result reproduced under the name mask; max probability gap 0.0; no prior-driven-risk flag |
| Skeptic counts | 16 claims fully checked — 10 survived, 6 weakened, 0 refuted; plus 2 unverifiable and 21 triaged-only |
The verdict was pressed hard. The decisive gate (P1) held its not-met result across two independent model families and again when the company's name was masked, so it is not an artifact of prior beliefs about Salesforce. The two contested criteria are contested honestly — the panel and the families disagreed, and that disagreement is reported rather than rounded into a clean answer.
Falsifier ledger
These are the standing conditions that would change the read — the framework's own what-would-change-this seeds and the name-specific thresholds, with direction and window where defined. They are reproduced verbatim from the tally:
Data gaps
What this run could not resolve, from the tally's list:
- Adjusted FCF and adjusted-FCF yield are not computable in fit_features: stock-based compensation was absent from the structured cash-flow feed (FY2017–FY2026) and the acquisition term defaulted to zero, so the deterministic adjusted series, the yield baseline, and float-retirement years could not be derived. The Yield tab reconstructs adjusted FCF directly from the filed 10-K cash-flow statements (SBC and business-combinations lines); this tab carries those reconstructed figures, and the re-rating math above is left unavailable rather than improvised.
- Balance-sheet class returned "unknown" (FY2026 EBITDA missing from the feature inputs); leverage is characterized from filed debt, cash and FCF instead, and the applicable yield bar is carried as an 8–10% range (net debt/EBITDA 0.41x including securities, 0.59x cash-only).
- IDC precise CRM share percentages and the full ranked competitor table are from web research, not the filing corpus — the corpus verifies the #1-provider statement but not the exact 20% share or the ~4x gap to the #2.
- Implied volatility and LEAPS existence rest on web sources (AlphaQuery, options-listing calendar), not a corpus PDF; IV is reported as found, never estimated.
- No corpus transcript for Q1 FY2027 (reported 2026-05-27); the freshest capital-return and Agentforce commentary is one quarter stale, and the $25B accelerated repurchase is cited to the Calls curation rather than a filing page.
- Reported short interest and days-to-cover are unavailable in the position feeds for this run, so the short-selling level and any forced/structural sellers cannot be quantified.
- China-specific revenue is not separately disclosed, so the S1 sensitivity is quantified only at the Asia Pacific level (10.4%).
Business
Salesforce sells subscription customer-relationship-management (CRM) software to businesses of every size and industry, booking $41.5 billion of FY2026 revenue at a ~$163 billion market cap with 83,334 employees. It is the world's largest CRM vendor — #1 global share for 13 straight years — and clears both universe screens (US-listed on the NYSE; well above the $10B line). It is no auto-OEM, and after a ~59% fall from its 2024 peak it screens as a de-rated name, not a consensus-saturated darling. Its own filing calls the market "fragmented, with low barriers to entry."
What Salesforce does
Salesforce, founded in 1999, is a global leader in CRM software: cloud-hosted applications that companies rent to run sales, customer service, marketing, commerce, data integration and analytics, with an AI layer (Agentforce) and a data layer (Data 360) layered on top [1]. The model is recurring subscription: customers sign contracts that typically run 12 to 36 months and pay in advance, and subscription and support supplied $39.4 billion — 94.9% — of FY2026 revenue [2]. The remaining $2.1 billion is professional services — implementation and advisory work that Salesforce runs at a small gross loss (negative $0.3 billion in FY2026), a lead-generating adjunct to the software rather than a profit line.
In two sentences: Salesforce is a subscription software company that has become the default system-of-record for enterprise sales and service teams worldwide, selling a suite of "clouds" plus a growing AI/data layer on one platform. Revenue is overwhelmingly recurring, diversified across tens of thousands of customers — none more than ten percent of revenue in any of the last three years — and reported as a single operating segment [3] [4].
Source: FY2026 Annual Report (Form 10-K), MD&A — Subscription and Support Revenues by Service Offering [5]. Professional Services from the same filing's revenue detail.
No single offering dominates: Sales and Service — the original CRM franchises — are roughly a quarter each, while the Platform/Slack, Data (Integration and Analytics) and Marketing/Commerce lines have grown into the balance, largely through acquisition (Slack, MuleSoft, Tableau). The business is therefore a portfolio of enterprise-application categories sold to a shared customer base, not a single-product company.
Scale and economics
FY2026 Revenue ($M)
Gross Margin
Operating Margin (GAAP)
Free Cash Flow ($M)
FCF Margin
Employees
Sources: FY2026 Annual Report, Consolidated Statements of Operations [6]; employee count, Item 1 Human Capital [7]; free cash flow per fit_features (reported FY2026 free cash flow).
Salesforce carries the economics of mature enterprise software: a 77.7% gross margin, a 20.1% GAAP operating margin, and $14.4 billion of free cash flow on $41.5 billion of revenue — a 34.7% FCF margin. It is a capital-light business; the plant is code and data centers, and the largest ongoing costs are people and sales-and-marketing rather than physical capex.
Source: revenue trajectory per fit_features (reported figures); FY2026 total ties to the Consolidated Statements of Operations [8].
Revenue has compounded at roughly 19% a year over the decade — from $8.4 billion in FY2017 to $41.5 billion in FY2026 — but the rate of growth has stepped down sharply, from mid-20s percent through FY2022 to 8.7% in FY2025 and 9.6% in FY2026. Management guides FY2027 growth of 10–11% and a $63 billion FY2030 revenue target (per its latest guidance, July 2026). The deceleration is the fact the market is now reacting to; the direction and durability of that curve belong to Durability and Yield.
Geography of revenue and assets
Source: FY2026 Annual Report, Notes to Consolidated Financial Statements — revenue by geography [9].
Salesforce is a US-centric business with international reach: the Americas are 65.5% of revenue, Europe 24.1%, and all of Asia Pacific just 10.4%. Assets are more concentrated still — 82% sit in the United States, and only 16% outside the Americas [10].
The universe screen
Both of the framework's universe lines are clear, factually. Salesforce is a US-domiciled company incorporated in Delaware and listed on the New York Stock Exchange under ticker CRM — a direct US common-stock listing, not an ADR, and not a Chinese issuer. Its market capitalization is roughly $163 billion (956 million shares at $170.77 on 2026-07-17, per fit_features.market_cap_usd), an order of magnitude above the $10 billion floor.
Market structure — the durability raw material
This is the evidence the durability question will lean on, and it points two ways.
For durability. Salesforce is the clear #1 in CRM: IDC has ranked it the largest CRM software vendor by revenue for 13 consecutive years, with an estimated 20.0% worldwide share in 2025 — roughly four times its nearest rival, Microsoft Dynamics 365 at about 5.2% (per IDC's Worldwide Semiannual Software Tracker, as reported July 2026). It has operated for 27 years, and its economics rest on genuine switching costs: the software becomes the system-of-record wired into a customer's sales and service workflows, with subscriptions sold enterprise-wide and paid a year in advance, so displacement is disruptive and slow. Management's own framing — the "#1 provider of CRM software globally" — is corroborated by the third-party share data [11].
Against durability. Salesforce's own 10-K describes its market as "highly competitive, rapidly evolving and fragmented, and subject to changing technology with low barriers to entry" [12]. Leadership is by share, not by regulation: there is no licensing regime, no capital barrier, and no charter keeping new entrants out — the opposite of the bank/insurer moats the framework prizes. The filing names its competitor set as packaged-software vendors, cloud application providers, single-product specialists, productivity/email incumbents, and — new in this year's language — "AI-native companies and emerging startups that leverage generative AI and large language models… offering highly specialized, autonomous, or automated solutions that may bypass traditional business process workflows or displace established user interfaces" [13]. The concretely named rivals — Microsoft, Oracle, SAP, Adobe, ServiceNow, HubSpot — are large and well-capitalized. The structure is best described as a fragmented applications market with one dominant vendor and a long tail, held together by switching costs rather than by any barrier to entry.
A note on the peer set: the documents indexed under competitors/ for this run — Adobe, ADP, ServiceNow, Shopify, Snowflake, Uber — were auto-selected by sector and size and are a loose match. Only ServiceNow, and Adobe in its marketing/commerce overlap, compete directly with Salesforce; the true nearest competitors (Microsoft, Oracle, SAP) are not in the indexed set, so peer benchmarks in this report should be read with that caveat.
Exclusion screen
Auto-OEM (X1) — not applicable. Salesforce is an enterprise-software company; it makes no vehicles and has no exposure to the automotive-manufacturing economics the exclusion targets.
Darling positioning (X4) — does not trigger. The exclusion targets high-growth names on extreme multiple-to-sales where consensus already owns the story. Salesforce screens as the near-opposite. At ~$163 billion over $41.5 billion of revenue it trades at roughly 3.9x sales and ~22x trailing GAAP earnings — and on forward earnings it is the cheapest of the mega-cap software names.
Source: forward P/E per third-party market data as of early July 2026, stated as dated third-party facts; not drawn from the filing corpus.
The chart shape is a de-rating, not a moon-shot: the stock is down about 59% from its December-2024 peak of $367.87 to a June-2026 trough of $150.12, and sits at $170.77 as of 2026-07-17 (per fit_features.capitulation_gauge), even as revenue rose 22% across FY2024–FY2026. Coverage tone is instructive: the sell side is still constructive — a consensus "Buy" with an average price target near $245 (per aggregated analyst data, July 2026) — but the fear narrative is specific and current: that enterprises will cut application-software seats to fund AI-infrastructure spend, a story that named Salesforce alongside ServiceNow after IBM's July commentary. A stock trading at half its peers' forward multiple, down 59%, with a live and specific bear thesis is not a consensus-saturated darling. Whether the fear is a temporary dislocation or a durable impairment is the work of Damage Math and Durability, not this tab.
China dependence (S1) — immaterial. Asia Pacific in total is 10.4% of revenue, and China is not separately disclosed, does not appear among the currencies Salesforce flags for FX exposure (Euro, Sterling, Yen, Canadian and Australian dollars, Brazilian real, Indian rupee — no renminbi), and is referenced in the 10-K only in generic geopolitical-risk boilerplate. China is not a material revenue or asset dependence for Salesforce.
Dislocation
Salesforce fell 59.2%, from an all-time high of $367.87 on December 4, 2024 to $150.12 on June 22, 2026, and trades at $170.77 today — a real, deep drawdown. But its anatomy inverts the framework's usual trigger. No earnings cut caused it: the last three quarters beat consensus by 13.6%, 24.9% and 24.1%, and forward estimates rose while the price fell. This is a multiple de-rating on decelerating growth and AI-disruption fear, not a Centene-style guidance shock.
The drawdown
Peak (Dec 4, 2024)
Trough (Jun 22, 2026)
Current (Jul 17, 2026)
Peak-to-Trough
Source: peak, trough, current and depth from the deterministic capitulation gauge (derived from daily price history). Feature: fit_features.capitulation_gauge.drawdown.
Source: month-end closes from daily price history, as reported. The intramonth extremes — the $367.87 peak (Dec 4, 2024) and the $150.12 trough (Jun 22, 2026) — are carried in the KPIs above. Feature: fit_features.capitulation_gauge.
The fall took 565 days and came in three distinct phases, not one shock. The de-rating drift (Dec 2024 to mid-2025): from $367.87 the stock slid to roughly $265 by mid-2025 — down about 28% — on ordinary volume of 6 to 8 million shares a day. Under the framework's own test, that first leg is drift, not a moment: no single event and no volume spike. The grind (mid-2025 to late 2025): a further step down toward $230, tracking each quarter's ~9% growth print. The capitulation (Dec 2025 to Jun 2026): the sharpest leg, from about $265 to the $150.12 trough — where the volume finally spiked (below). The rebound since is modest: at $170.77 the stock sits 53.6% below the peak and 13.8% above the trough.
The trigger
There is no single dated adverse event of the kind the framework hunts — no guidance cut, no earnings miss, no restatement. What repriced Salesforce is a sequence of growth-deceleration prints against a hardening AI-disruption fear, and the primary record shows the fundamentals moving the opposite way from the price.
The clearest dated marker is the fiscal-2025 results call on February 26, 2025. Management guided fiscal-2026 revenue to $40.5 billion to $40.9 billion — growth of just 7% to 8%, a sharp step down from the 24%+ of prior years — and set non-GAAP EPS guidance of $11.09 to $11.17, while explicitly assuming only a "modest contribution" from Agentforce in fiscal 2026 [1]. The number that mattered was the growth rate, not a cut to earnings.
The de-rating character shows most plainly in what did not stop it. On the September 3, 2025 call, Salesforce beat, raised the low end of full-year revenue guidance to $41.1 billion to $41.3 billion, and announced a $20 billion expansion of its buyback authorization [2]. The stock fell 4.9% the next day and kept sliding. Fiscal 2026 closed at $41.5 billion of revenue, up 10% [3]. Prints that would have lifted the stock in prior years now met selling.
The mechanism behind the fear is legible in the company's own risk disclosure: the market for enterprise applications is "highly competitive, rapidly evolving, fragmented and subject to changing technology, low barriers to entry" [4]. The market's worry through 2025 and 2026 was that agentic AI erodes the pricing power of seat-based enterprise software — a "SaaSpocalypse," in the phrase management itself used. The final leg is illustrative: after the May 27, 2026 fiscal-Q1 print beat EPS by 24% and the stock jumped to $209.60 on June 1, it collapsed 28% to the $150.12 trough over the next three weeks, a move driven by soft next-quarter revenue guidance and AI-disruption fear rather than any deterioration in reported results. The June 2026 intraday trigger itself post-dates the filing corpus and is not resolvable to a primary document here.
Whether that fear reflects real, lasting damage to intrinsic value — or a mispricing — is the temporary-versus-permanent question decided in the Damage Math trial and the durability evidence in Durability. This tab describes what happened, not what it means for value.
The fear gauge
Source: monthly average daily volume from daily price history, as reported. Pre-peak baseline (median daily volume over the 180 days before the peak) was 5.22 million shares. Feature: fit_features.capitulation_gauge.volume_spike.
The capitulation gauge measures the peak 20-day average volume in the peak-to-trough leg at 3.5x the pre-peak median of 5.22 million shares — a genuine spike, and it fired where the framework wants it: at the bottom, not the top. Through the first, drifting leg of the fall, volume ran near its ordinary 6-to-8-million-share pace. It then built steadily as the stock broke down — to a 15.7-million-share monthly average in February 2026 and 17.1 million in June 2026, the trough month. The single heaviest day of the entire drawdown was June 18, 2026, four sessions before the low, at 55.4 million shares — 10.6x the pre-peak median — on a down day. Heavy, emotion-driven selling clustered into the final leg and exhausted at the bottom, which is the capitulation signature rather than an orderly repricing.
Who was selling
Reported short interest for Salesforce is not available in the official/public position feeds for this run, so the short-selling level and change cannot be quantified here — a data gap. No forced or structural sellers (index exits, fund liquidations, large insider disposals) are disclosed in the corpus for this window.
What the evidence does support is that the selling was valuation-sensitive, not information-driven: it repriced the multiple while the underlying estimates rose (next section). The most concrete counter-party fact is on the buy side. Salesforce was the marginal buyer of its own stock throughout the fall — repurchasing $12.6 billion of shares in fiscal 2026 and taking its share count from 997 million (FY2023) to 956 million (FY2026). On the February 25, 2026 call, with the stock near $190, management raised the repurchase authorization to $50 billion, said it returned "more than $14 billion or 99% of our free cash flow to shareholders," and characterized the tape directly: "this obviously is not a rational market," these are "some low prices" [5]. The company's capital-allocation behavior — treated in full in Self-Help — reads as the opposite of a forced seller. The strongest fact against a purely irrational read is that reported revenue growth did decelerate to roughly 9-10%, so some of the sellers were repricing a genuinely slower-growing business, not only fleeing sentiment.
Estimates versus price
The framework's canonical setup is a price fall that outruns an estimate cut. Salesforce presents the extreme version: there was no estimate cut at all. As the stock fell, consensus for the current forward year rose.
Source: FY2027 consensus normalized EPS from CapIQ estimate momentum (data/sp/estimates.json); CRM closes from daily price history, as reported. Feature context: fit_features.consensus_forward_yield.
From January 22 to June 21, 2026, the fiscal-2027 EPS estimate rose 7.1% — from $13.20 to $14.13 — while the price fell 33.5%, from $228.09 to $151.78. Fiscal-2027 revenue consensus held essentially flat over the same span (about $46.1 billion). The entire move was compression of the multiple, not a downgrade of the numbers: against fiscal-2026 non-GAAP EPS guidance of roughly $11.13, the December-2024 peak of $367.87 implied about 33 times forward earnings; at $170.77 against the $14.13 fiscal-2027 consensus, the multiple is about 12 times. The forward earnings base grew as the multiple more than halved.
Consensus also agrees on the cash side. Sell-side forward free-cash-flow estimates imply a yield on today's ~$163 billion market cap of 8.7% for fiscal 2026, 9.1% for fiscal 2027 and 10.0% for fiscal 2028 — the sell side is not modeling a collapse in cash generation; it is the buy side that repriced. Where those forward yields sit against the framework's balance-sheet-scaled bar is computed in Yield.
Bottom line
Salesforce is a genuine dislocation by magnitude — a 59.2% peak-to-trough fall with a real, late-firing volume capitulation. It is not the framework's canonical trigger: no earnings cut anchored the price. Estimates rose through the fall, every recent quarter beat, and the company itself bought stock hand-over-fist at what management called irrational prices. What repriced is the multiple — compressed from roughly 33x to about 12x forward earnings — on decelerating ~9-10% growth and the fear that agentic AI erodes seat-based software. Whether that fear is deserved is the trial's question, not this tab's.
Damage Math
Salesforce is a damage-math anomaly: the price fell about 54% from its peak while the near-term cash engine grew. Free cash flow rose from $9.5B (FY2024) to $14.4B (FY2026) and forward consensus held flat to higher through the drawdown. So the usual numerator — a near-term earnings cut — is roughly zero. The de-rating instead reprices the durable growth rate. Whether that repricing is an overshoot or correct is the trial's contested question, ruled 0.62-probable-temporary.
The near-term hit, quantified
The framework's usual trigger is a short-term earnings cut the market then anchors to. Here the numerator barely exists. Across the window that carries the drawdown — the December 2024 peak to today — Salesforce's reported cash flow rose and forward consensus did not fall.
Free cash flow compounded straight through the decline. Operating cash flow was $10.2B in FY2024, $13.1B in FY2025 and $15.0B in FY2026 [1]; on the profile's feed that nets to free cash flow of $9.5B, $12.4B and $14.4B — a 16% rise in the last year and 52% over two years, entirely inside the price fall (fit_features.adjusted_fcf).
Source: FY2024–FY2026 actuals derived from company filings (operating cash flow less capex), FY2026 10-K [2]; FY2027e–FY2029e are S and P Capital IQ consensus, data/sp/estimates.json (vendor vintage 2026-07-21). Feature: fit_features.consensus_forward_yield.
Forward consensus tells the same story. Over the roughly 180 days spanning the June 2026 trough, FY2027 revenue consensus held near $46.1B and FY2027 normalized EPS rose from $13.20 to $14.13 (+7.1%); FY2028 revenue held near $50.5B and FY2028 EPS edged from $15.14 to $15.51. Estimates did not impair; several inched up.
Source: S and P Capital IQ consensus revision snapshots, data/sp/estimates.json (vendor vintage 2026-07-21). Snapshots dated 2026-01-22 (180d) and 2026-07-21 (now).
The prints that landed after the fear peaked confirmed earning power rather than eroding it: normalized EPS beat consensus by 13.6% in Q3 FY2026, 24.9% in Q4 FY2026 and 24.1% in Q1 FY2027 ($3.88 vs $3.13), on S and P Capital IQ consensus (data/sp/estimates.json, vendor vintage 2026-07-21). On the framework's own numerator, then, the near-term hit is not negative — it is slightly positive.
The price and value moves, side by side
Set that against the price. Salesforce peaked at $367.87 on December 4, 2024 and trades at $170.77 today, with a $150.12 intraday trough on June 22, 2026 — a 59.2% peak-to-trough fall and 53.6% peak-to-today (fit_features.capitulation_gauge.drawdown). On ~975M shares at the peak and 956M today, market capitalization fell from roughly $359B to $163.3B — about $196B, or 54.6%, of equity value erased (fit_features.market_cap).
Source: EPS and FCF from data/sp/estimates.json and company filings [3]; price and market cap from fit_features.capitulation_gauge and fit_features.market_cap.
Enterprise value moves with it. The profile's feature carries net debt of $7.1B, putting current EV near $170.4B (fit_features.balance_sheet_class); on a marketable-securities-inclusive basis consensus actually shows a small net-cash position (FY2026 net debt −$4.6B in data/sp/estimates.json), so Salesforce is roughly balance-sheet-neutral and EV tracks market cap within a few billion. Either way the arithmetic is the same: consensus FY27 EPS rose ~7% and FCF rose 16%, while the market cap fell ~55%. That divergence is the whole subject of this tab.
The NPV arithmetic
Because there is no near-term cash hit, the standard "N years of reduced cash, then recovery" model returns essentially zero NPV damage — the temporary-impairment floor here is that the problem destroyed no measurable cash flow at all. The de-rating is therefore a repricing of the durable growth rate and terminal value, not of near-term earnings. Two transparent tools bound it.
Assumptions, stated. Discount rate r = 9% (cost of equity for a mega-cap software franchise; sensitivity shown). Base free cash flow = FY2026 actual $14.4B. Ten years of explicit FCF growth plus a Gordon terminal value, discounted to equity value, compared to today's $163.3B market cap and the ~$359B peak. Salesforce's FCF is levered (post-interest) and net debt is immaterial, so the discounted stream is compared to equity value directly.
Tool one — a two-scenario DCF-lite. The scenarios differ only in the durable growth path.
Source: derived; ten-year explicit FCF projection off the FY2026 $14.4B base plus a Gordon terminal value, discounted at the stated rate. Reproducible from the assumptions above and the base FCF in fit_features.adjusted_fcf.
The current $170.77 sits between the two pessimistic rows — it requires FCF growth to fade toward flat-to-declining, or an AI-risk discount rate of 10–11%, before plausible NPV matches the price. A temporary re-acceleration values the equity near $432 a share; even a moderate permanent maturation to mid-single-digit growth values it near $278. The price is consistent only with the bearish end of the permanent reading.
Tool two — reverse the DCF. For a stable grower, price/FCF ≈ 1 / (r − g), so today's price implies a single perpetual FCF growth rate the reader can judge directly.
Source: derived; implied g = r − (FY2026 FCF $14.4B / market cap), with current cap $163.3B and peak cap ~$359B on $12.4B trailing FCF. Reproducible from fit_features.market_cap and fit_features.adjusted_fcf.
At a 9% discount rate, today's price embeds roughly zero perpetual FCF growth; the peak embedded about 5.5%. The de-rating has stripped out five points of assumed long-run growth from a business whose cash flow is currently compounding double digits and whose consensus FCF keeps rising — a forward FCF yield of 9.1% (FY27), 10.0% (FY28) and 10.9% (FY29) on today's cap (fit_features.consensus_forward_yield), cross-referenced in the Yield tab.
The gap. The price destroyed about $196B (−54.6%) of market cap. The near-term cash flow destroyed nothing — it grew. So under a temporary reading the NPV damage is roughly zero and the gap is nearly the entire drawdown; under a moderate-permanent reading the equity is worth ~$265B, a ~$94B (26%) haircut from the peak, still leaving ~$100B of unexplained price damage versus today's $163B. The gap only closes — price damage roughly equals plausible NPV damage — at the bearish-permanent end: terminal FCF growth near zero-to-negative, or a 10–11% AI-risk discount rate. Which of those readings holds is not this tab's to decide.
The trial, presented fairly
The temporary-versus-permanent question was argued by two opposing, corpus-cited briefs and ruled on by three blind judges. Both cases are strong.
The case for temporary. The impairment is essentially pure multiple compression: at the peak Salesforce traded ~29x trailing FCF, today ~11x, while FCF grew $12.4B → $14.4B. Consensus never impaired the NPV — FY2027 revenue held flat and EPS rose; forward FCF is modeled to keep rising to $17.8B by FY2029. Q4 FY2026 revenue re-accelerated to +12% year over year and Q1 FY2027 EPS beat by 24% [4]. Management raised its FY2030 revenue target to $63B and, calling the tape "obviously not a rational market," lifted the buyback authorization to $50 billion after returning 99% of FY2026 free cash flow [5]. Cannibalization would show as falling ARR and FCF; both are rising.
The case for permanent. The old 20%+ compounding engine has reset to high-single digits, and the NPV of a 9% grower is structurally below that of a 25% grower even with cash flow intact. Revenue growth fell from five straight ~25% years to 18.3%, 11.2%, 8.7% and 9.6% in FY2023–FY2026 (fit_features.revenue_trajectory). The core is mature: in FY2026 Agentforce Sales grew 8%, Service 8% and Marketing and Commerce just 3% [6]. cRPO growth was "somewhat disappointing" at 9% [7]. And the latest acceleration is partly bought: Q1 FY2027 revenue growth was "bolstered by the acquisition of Informatica" and roughly two points of FX, with Agentforce Apps up only 9% against Data 360 up 25% [8][9]. A reset terminal growth rate lowers the NPV permanently, cash flow notwithstanding.
The ruling. The judges put the probability the impairment is temporary at 0.62, with individual seats at 0.62, 0.42 and 0.68 — a range of 0.42 to 0.68 and a spread of 0.26. The ruling is formally contested: reading order moved the mean only 0.07, so the disagreement is substantive, not an artifact. Read plainly, the panel leans temporary but does not settle it — the permanent case commands a real minority. This tab reports that number; it does not override it. The moat evidence behind the durability question is developed in Durability.
Which line broke, and whether it self-corrects
The driver behind the hit is not a cash shortfall but a growth-rate reset concentrated in the mature core. Subscription revenue grew 10% in FY2026, held back by Marketing and Commerce at 3% and the Sales and Service clouds at 8% each [10]; the forward-looking cRPO line grew 9% [11]. Consecutive-decline years on the framework's own test are zero (fit_features.revenue_trajectory), so this is deceleration off a high base, not decline — but the level has reset.
The self-correction mechanism, if the reading is temporary, runs through two channels. First, monetization of the same AI shift that is feared: in Q1 FY2027 the newly disclosed Data 360, Headless Platform and Other category grew 25%, versus 9% for Agentforce Apps [12]. Second, the buyback flywheel: Salesforce returned more than $14B in FY2026 — 99% of free cash flow — and authorized $50B more at what management called low prices [13], retiring float from 974M (FY2022) to 956M (FY2026) and lifting per-share value regardless of when sentiment turns (fit_features.share_count_trend); the capital-return record is examined in Self-Help.
The mechanism against self-correction is that the growth engine now leans on acquisitions and FX rather than clean organic repair — the Informatica contribution and two points of currency in Q1 FY2027 [14] — and that agentic, consumption-priced AI could displace seat-based subscription before it fully replaces it. If organic growth ex-Informatica and ex-FX proves sub-8% and still decelerating, or FY2027 FCF falls below $14.4B, the permanent reading gains the arithmetic. Those are the lines to watch; the trial's flip conditions name them precisely.
Yield
Salesforce screens cheap on reported free cash flow — about an 8.8% yield after a 59% drawdown. On the framework's adjusted basis, reported FCF minus stock-based compensation minus the five-year average of acquisition spend, FY2026 free cash flow of $14.4 billion falls to roughly $5.4 billion, a 3.3% yield — some 470 to 570 basis points below even the 8–9% fortress bar. The most charitable version, stripping only stock comp, still leaves 6.7%. Consensus reversion above the bar within one to three years is low-probability on the adjusted basis.
A note on the feature file: the deterministic derivation (fit_features.adjusted_fcf) returns not_computable because the structured cash-flow feed carries no stock-comp or acquisitions line — so it could not subtract SBC and defaulted acquisitions to zero. Every adjusted figure below is derived directly from the filed 10-K cash-flow statements (FY2021–FY2026) and is captioned as such. The gap is recorded in the claims ledger.
The adjustment, line by line
Salesforce's reported free cash flow has compounded from $4.1 billion (FY2021) to $14.4 billion (FY2026) [1]. Two lines sit between that number and cash a shareholder can claim. The first is stock-based compensation, a genuine non-cash expense that the cash-flow statement adds back but that dilutes the owner: $3.5 billion in FY2026 [2]. The second is acquisition spend. Salesforce is a serial acquirer — MuleSoft, Tableau, Slack ($14.9 billion of cash in FY2022) [3], and Informatica ($8.1 billion, net, inside FY2026's $9.3 billion) [4]. The framework charges the five-year average of that spend against FCF, because for this kind of company acquisitions are how growth is bought and that cash never reaches the owner.
Source: reported FCF and SBC derived from filed cash-flow statements — FY2026 10-K [5], FY2024 10-K [6], FY2023 10-K [7]. Adjusted FCF = FCF − SBC − trailing five-year average acquisition spend; shown only for FY2025–FY2026, the years whose full five-year acquisition window falls inside the corpus.
The five-year average acquisition charge is $5,480 million for FY2026 (the mean of FY2022–FY2026 business-combination outflows: $14,876M, $439M, $82M, $2,734M, $9,268M) and $3,882 million for FY2025 (FY2021–FY2025). That gives adjusted FCF of $5,413 million for FY2026 ($14,402M − $3,509M − $5,480M) and $5,369 million for FY2025 ($12,434M − $3,183M − $3,882M). The earlier years' adjusted column is left blank because their five-year acquisition window reaches before FY2021, the oldest year the indexed filings cover.
Source: derived from FY2026 10-K Consolidated Statements of Cash Flows [8]; five-year average acquisition spend from filed cash-flow statements FY2022–FY2026 [9].
The reported figure overstates the owner's yield because roughly $9 billion of FY2026 free cash flow was consumed by stock issued to employees and cash paid for a company — neither of which is distributable.
The yield, three ways
At the current price of $170.77 (July 17, 2026) and 956 million shares, the market capitalization is $163.3 billion. Three readings of the yield follow, and they diverge sharply depending on how much of the reported number one is willing to keep.
Reported FCF Yield (FY2026)
After SBC Only
Adjusted FCF Yield
Source: adjusted and after-SBC free cash flow derived from FY2026 10-K cash-flow statement [10]; market cap from the price feed (956M shares at $170.77, July 17, 2026).
Current adjusted yield: 3.3%. Adjusted FCF of $5,413 million over the $163.3 billion market cap. Strip only stock comp and leave acquisitions untouched, and the yield is 6.7% ($10,893 million over $163.3 billion). The headline reported yield is 8.8%.
Three-year average: about 2%. Applying the normalized $5,480 million five-year M and A charge to each year's FCF-after-SBC gives adjusted FCF of $1,231 million (FY2024), $3,771 million (FY2025), and $5,413 million (FY2026) — a three-year mean of $3,472 million, or 2.1% on the current market cap. On each year's own trailing five-year window (which lifts FY2025 to $5,369 million), the three-year average is closer to 2.5%. Either way it sits below the current single-year figure, because FY2026 free cash flow is the high point of the series.
The baseline, and whether this is a jump. The framework's own five-year adjusted-yield baseline (fit_features.yield_baseline) is not_computable — the historical adjusted-FCF series was never built, for the same reason the current one had to be derived by hand. What can be shown is the reported free-cash-flow yield at each fiscal year-end, which does carry the fortress signature Ruchir looks for: a stable 2–4% through FY2021–FY2025 that jumped to 8.8% after the drawdown.
Source: reported FCF from filed cash-flow statements [11]; year-end and current market caps from the price feed. Adjusted yield shown only for FY2025–FY2026, where the acquisition window is sourceable.
The reported line reproduces the pattern the framework hunts — a name that yielded ~2–4% now yielding ~8.8% on a forced-selling drawdown, structurally like Microsoft's 4%-to-9% move. The adjusted line tells the other half: the jump is real but small in absolute terms, from roughly 1.6% to 3.3%, and it clears no bar. The reported optics and the adjusted arithmetic point in opposite directions, and the framework runs on the adjusted number.
Which bar applies
The balance-sheet class selects the reference line, and fit_features.balance_sheet_class returns unknown only because FY2026 EBITDA was missing from the feed. It computes cleanly from the filings. Net debt is total debt of $14,439 million ($4,000M current plus $10,439M noncurrent) less $7,327 million of cash — $7,112 million; counting the $2,238 million marketable-securities book alongside cash ($9,565 million of total liquidity), net debt is $4,874 million [12] [13]. EBITDA is operating income of $8,331 million [14] plus $3,631 million of depreciation and amortization [15], or $11,962 million.
Source: balance sheet [16], operating income [17], and D and A [18], FY2026 10-K.
Net debt runs 0.4 to 0.6 times EBITDA, straddling the fortress line (≤0.5x). A year earlier, before the $6 billion debt raise for Informatica, cash and securities of $14.0 billion exceeded $8.5 billion of debt principal — a net-cash, unambiguous fortress. Salesforce is investment grade, generates $15 billion of operating cash a year, and its leverage is a recent, modest, deal-financed step. The fortress bar of 8–9% is the right reference line, with the 10% moderate bar a secondary check.
Against the 8% fortress bar, the current adjusted yield of 3.3% sits roughly 470 basis points short; against 9%, about 570 basis points short. Even the most charitable reading — 6.7%, charging stock comp but nothing for acquisitions — is 130 to 230 basis points short of the fortress line, and 330 short of the 10% bar. On no accounting does the adjusted yield reach Ruchir's entry line.
Normalization
Salesforce is not a cyclical. Revenue has risen every year for a decade, decelerating from 25% growth to about 9%, with no down year to normalize toward a mid-cycle. So there is no depressed-margin add-back to make.
The judgment call here is acquisition lumpiness, not the cycle. Two mega-deals — Slack in FY2022 and Informatica in FY2026 — account for $24.1 billion of the $27.4 billion of acquisition cash in the FY2022–FY2026 window; the intervening years ran $82 million to $2.7 billion. A skeptic can argue the five-year average of $5.5 billion overstates a normal run-rate, and that ex-mega-deals the M and A drag is closer to $1–1.5 billion. That is why the after-SBC yield of 6.7% is the fair upper bound: it charges nothing for acquisitions at all. The counter is that Salesforce has closed a multi-billion-dollar acquisition roughly every two to three years for a decade, so a five-year average is the honest run-rate rather than an outlier. At a $1.5 billion normalized M and A charge, FY2026 adjusted FCF is about $9.4 billion and the yield 5.8% — still under the fortress bar, which is why the reversal case does not change the read.
The consensus check
Consensus forward free cash flow, from CapIQ estimates, rises steadily and does clear the bar on a reported basis — 7.4% on FY2025, 8.7% FY2026, 9.1% FY2027, 10.0% FY2028, 10.9% FY2029, all on today's market cap (fit_features.consensus_forward_yield, vintage as of the run). But the vendor metric is reported free cash flow — the FY2025 consensus of $12.1 billion sits right on the reported figure of $12.4 billion — so it carries no stock-comp or acquisition adjustment. On the framework's basis, the picture is different.
Source: consensus reported FCF from CapIQ estimates via fit_features.consensus_forward_yield (data/sp/estimates.json); adjusted estimate deducts about $4B of stock comp and the $5.5B five-year M and A charge from consensus FCF — derived, illustrative.
Take FY2029 consensus FCF of $17.8 billion, subtract roughly $4 billion of stock comp (SBC has grown every year and would keep pace) and the $5.5 billion M and A charge, and adjusted FCF is about $8.3 billion — a 5.1% yield on today's price. Even stripping only stock comp and charging nothing for acquisitions, FY2029 lands at 8.4%, just touching the fortress line, and only under the assumption that Salesforce stops doing mega-deals.
So the mean-reversion underwrite is explicit: for the adjusted yield to reach the 8% fortress bar on the current $163 billion market cap, Salesforce needs about $13 billion of adjusted FCF. The path that gets there within one to three years requires two things at once — reported FCF continuing to compound toward $17–18 billion (which consensus grants by FY2029, four years out) and the market accepting a stock-comp-only adjustment, i.e. betting that the serial-acquisition run-rate falls to near zero. Given the decade-long deal cadence, I put the probability of the adjusted yield clearing 8% within three years at roughly 20–25%, and it rests almost entirely on the charitable no-more-M and A reading; on the full-framework basis (with the M and A charge intact), reversion above 8% is not on the consensus path inside three years. The reported-yield optics say fear; the adjusted arithmetic says the fundamentals do not clear the bar. What would move this: a durable collapse in stock comp as a share of revenue, or an end to multi-billion-dollar acquisitions — either would be visible in the Self-Help share-count and capital-allocation record.
FCF-to-revenue trend
Cash conversion is improving, which cuts in the company's favor and against the reflex that a serial acquirer bleeds cash. Reported free cash flow as a share of revenue climbed from 19% in FY2021 to 35% in FY2026, as operating margin expanded and capital intensity stayed near 1.4% of revenue.
Source: FCF from filed cash-flow statements [19]; revenue from reported financials, FY2021–FY2026.
Even net of stock comp, conversion improved from about 9% to 26% of revenue over the same span. A rising conversion trend is what the framework wants to see — it does not undercut the case; the shortfall is in the level of adjusted yield against price, not in the direction of cash generation. On consistency, the framework's fit_features.fcf_stability is not_computable (it needs the adjusted series it never built), but the reported record is unambiguous: free cash flow rose in every one of the last ten fiscal years, from $1.7 billion in FY2017 to $14.4 billion in FY2026, with no negative episode. Predictability, the property Ruchir prizes, is present; it is the adjusted yield on today's price that is not.
Durability
Salesforce has grown revenue in each of the last ten fiscal years ($8.4B to $41.5B) and free cash flow in each of them ($1.7B to $14.4B), so the framework's structural-decline disqualifier is not tripped. But the conviction sources the year-10 gate rewards mostly do not apply here: the market is fragmented and low-barrier by the company's own account, there is no regulatory or capital-intensity moat, and the seat-based model faces a live AI-agent threat the 10-K itself concedes could cut demand. The gate turns on that doubt.
What the year-10 gate asks
Ruchir's one pure gate is binary by construction: year-10 revenue and adjusted free cash flow higher than today, held with very high conviction — and any proper doubt fails it. Conviction is supposed to come from structural sources (market structure, regulatory barriers, capital intensity, essentialness, long history), not from execution. This tab grades each source for Salesforce specifically, hunts the structural threats, checks the disqualifier flag, and states the read once. It builds on the market-position work in Business rather than repeating it.
The disqualifier check — revenue trajectory
The framework's one mechanical exclusion is revenue declining high-single-digit for three consecutive fiscal years after a long existence. Salesforce's revenue_trajectory feature records consecutive_decline_years of 0 and three_year_hsd_decline of false: revenue has risen every year in the corpus.
Source: FY2026 Annual Report (Form 10-K), Consolidated Statements of Operations, and prior-year 10-Ks; per fit_features.revenue_trajectory [1].
The disqualifier is not close to firing. What the chart also shows, and what matters for the gate, is deceleration: year-over-year growth fell from roughly 29% in FY2020 to 8.7% in FY2025 and 9.6% in FY2026.
Source: derived from reported revenue, FY2018–FY2026 10-Ks; per fit_features.revenue_trajectory [2].
The level is rising; the rate is compressing toward high single digits. Both facts belong in the year-10 read below.
The conviction sources, graded for this company
Salesforce is the #1 provider of CRM software globally and has been public and profitable in cash terms for years [3]. But leadership is not the same as the structural protection the gate rewards, and most of Ruchir's conviction sources are tuned for capital-heavy regulated essentials — the opposite archetype to asset-light software.
Sources: FY2026 10-K Item 1 Business [4]; Item 1A Risk Factors [5]; capex from the cash-flow statement [6]; customer concentration [7].
The one source that clearly applies is essentialness. Salesforce is a system of record: customers "have invested substantial personnel and financial resources to implement and integrate their current enterprise software" and are "reluctant or unwilling to migrate away," in the 10-K's own words [8]. Data gravity and workflow integration are real switching costs, and customer concentration is negligible — no single customer reached 10 percent of revenue in FY2026 or FY2025 [9].
The sources that do not apply are the ones the framework prizes most for surviving the AI world. There is no monopoly or regulated oligopoly: the company describes the market for enterprise applications as "highly competitive, rapidly evolving, fragmented and subject to changing technology, low barriers to entry" [10], and names competitors with "greater name recognition, longer operating histories, more significant installed bases" — the large incumbents (Microsoft, Oracle, SAP, Adobe, ServiceNow) plus more agile smaller players. There is no regulatory barrier to entry, and capital intensity — the framework's shelter for "capital-heavy essentials" that survive even when they are not the best businesses — runs the wrong way: capex was about 1.4% of revenue in FY2026 [11]. What is left is switching-cost strength, which sits close to product and execution — and the framework is explicit that execution is not a moat.
The structural threats, hunted
The threat that matters for the year-10 clock is the one Ruchir frames as "is anyone's margin here an Amazon opportunity?" For Salesforce it has a name: AI agents against the seat-based licensing model.
Salesforce sells "primarily on a subscription basis" [12], and much of that revenue is priced per human seat. The 10-K states the risk plainly: as AI is built into the market, "New AI offerings may disrupt our service offerings or transform workforce needs and negatively impact demand for our offerings, or our competitors may be able to incorporate AI into their offerings more efficiently or successfully than we are able to" [13]. The company reinforces the point in its dedicated AI risk factor, noting it is "increasingly building AI into many of our offerings, including generative and agentic AI," with attendant adoption risk [14].
The mechanism, quantified. If AI agents reduce the number of human service and sales agents an enterprise needs, a per-seat CRM faces volume, not just pricing, pressure: fewer licensed users in the service cloud. For the revenue level to keep rising, consumption revenue from AI work (Agentforce, priced per task rather than per seat) has to more than offset any seat erosion. External research puts numbers on the risk: Gartner has projected that roughly 35% of point-product SaaS tools could be displaced by AI agents by 2030, and in May 2026 a Bank of America analyst reinstated an Underperform rating with a $160 target, calling the shift an AI-driven structural reset (external analyst estimates, dated May 2026; not sourced to the filings). This is not a filings-visible fact, so it is carried as context, not as a cited number — but it is the fear repricing the stock, and it is structural rather than cyclical.
The threat is genuine and unresolved, but it is bounded by three facts. Salesforce is itself the largest vendor of the agentic tools doing the disrupting; its pricing is already migrating toward consumption; and the switching costs above make wholesale replacement slow. The plausible year-10 outcome is therefore compression of the growth rate and a mix shift in how revenue is earned, more than a decline in the revenue level — but the range of outcomes has widened, which is exactly what erodes "very high conviction."
Other threats are lower. Customer concentration is negligible [15]. Regulatory reversal is not a material lever for a horizontal software vendor. The subscription base must still be renewed — customers "have no obligation to renew their subscriptions… typically 12 to 36 months, and in the normal course of business, some customers have elected not to renew" [16] — but that renewal risk is the ordinary texture of the model, not a structural break.
FCF consistency (P2)
The deterministic adjusted-FCF stability series is not computable. fit_features.fcf_stability is empty and adjusted_fcf.latest_adjusted is null because stock-based compensation is absent from the cash-flow data feed for every year FY2017–FY2026, so the profile could not build the rolling five-year adjusted-FCF average (not_computable.fcf_stability: "fewer than five consecutive adjusted-FCF years"). That limitation is stated rather than filled by mental math.
On a reported free-cash-flow basis, the series is unusually consistent — it rose in every one of the last ten years, with no negative episodes.
Source: FY2026 Annual Report (Form 10-K), Consolidated Statements of Cash Flows, and prior-year 10-Ks; per fit_features.adjusted_fcf.series[].fcf [17].
This is a recurring-revenue subscription profile, not the underwriting-cycle pattern Ruchir tolerates in insurers and banks: there is no 5-to-8-year negative cadence to explain because there are no negative years. On the reported basis, predictability is high. The caveat is real and one-directional — the reported figure is before the roughly $3B-plus of annual stock-based compensation that the adjusted metric would subtract; the Yield tab carries the adjusted-yield arithmetic, and the true adjusted-FCF level is materially lower than the reported line. But nothing in the record suggests the adjusted series would be unstable; it would simply be lower and, given SBC's own steadiness, similarly smooth.
The year-10 case, both ways
The strongest case that year-10 revenue and FCF are higher. Ten consecutive years of rising revenue and rising free cash flow is a powerful base rate. Salesforce is the category leader in a still-growing market [18], sits inside its customers' systems of record with deep switching costs [19], carries no customer concentration [20], and is the largest supplier of the very agentic tools said to threaten it. Consensus, tracked in Yield, still has free cash flow rising through FY2029 (fit_features.consensus_forward_yield). Even at high-single-digit growth, revenue and FCF a decade out are, on the balance of evidence, more likely higher than lower.
The strongest doubt. The conviction the gate demands is supposed to be structural, and here it mostly is not. The company itself calls its market fragmented and low-barrier [21]; there is no regulatory shelter and, at about 1.4% of revenue in capex, no capital-intensity moat [22]; the operating history is shorter than the framework prefers. What protects the franchise is switching-cost strength, which is closest to execution — and execution is not a year-10 moat. Against that thinner structural base sits a live, named threat the filing concedes could "transform workforce needs and negatively impact demand" for the seat-based model [23].
The read. On base rates, year-10 revenue and free cash flow are more likely higher than not, and the structural-decline disqualifier is clearly not tripped. But the gate does not ask whether the outcome is likely; it asks whether it is held with very high conviction, and it fails on any proper doubt. That conviction is not available here: the moat rests on switching costs alone, without the market-structure, regulatory, or capital-intensity protection the gate rewards, and the AI-agent threat to the seat model is exactly the kind of "your margin is my opportunity" doubt the framework treats as decisive — genuine, current, and unresolved. On the framework's binary standard, there is a genuine doubt, and the gate does not clear.
Self-Help
Salesforce can clearly outlast its problem: net debt of roughly $4.8 billion sits against $14.4 billion of annual free cash flow, and the only near-term maturity is a $4.0 billion acquisition bridge. It is spending heavily on repurchases — $28 billion over three years and a $50 billion authorization — and returned 99% of free cash flow in FY2026. But stock-based compensation absorbs roughly two-thirds of that, so the share count has fallen only about 1.4% a year.
The balance sheet against the problem's duration
The dislocation here is a growth-and-multiple problem, not a solvency one. Salesforce carries $14.44 billion of debt at carrying value against $9.6 billion of cash, equivalents and marketable securities, plus an undrawn $5.0 billion revolving facility that runs to October 2029 [1]. Net debt is roughly $4.8 billion on that liquidity measure, or $7.1 billion counting cash alone — either figure is a fraction of one year's free cash flow. The deterministic feature file leaves the balance-sheet class as unknown because FY2026 EBITDA was missing from its inputs; on the figures in the filings, leverage is well below one turn of cash flow by any reasonable EBITDA estimate.
Source: FY2026 Annual Report (Form 10-K), Note 9 Debt — contractual future principal payments [2].
The maturity wall is benign. The $4.0 billion due in FY2027 is the 364-day tranche of the Informatica acquisition financing, borrowed in November 2025 at a floating 4.42% [3] — repayable from a single quarter of operating cash flow. Nothing falls due in FY2028; the $4.5 billion in FY2029 is two senior-note tranches plus the three-year Informatica facility. Everything from FY2031 out is $6.0 billion of senior notes struck in 2021 at coupons of 1.95% to 3.05%, so cheap that their market value was just $6.7 billion against a higher face [4]. Total cash interest paid in FY2026 was $276 million [5]. The company reported compliance with all debt covenants at year-end [6].
The one thing worth naming is that this balance sheet is a year past its most comfortable point. Through FY2025 Salesforce ran roughly net-cash. In FY2026 it drew $6.0 billion of new debt to help fund the $8.1 billion Informatica purchase while still buying back $12.6 billion of stock and paying $1.6 billion of dividends [7]. It ran all three uses of cash at once and let leverage tick up to do it. That is a choice, not a constraint — but it is the first evidence that repurchases have to share the till with acquisitions, which is the live question for capital allocation, not debt service.
The repurchase record — executed, not just authorized
The buyback is real cash out the door, not a press release. Salesforce spent $7.62 billion (FY2024), $7.83 billion (FY2025) and $12.60 billion (FY2026) on repurchases per the cash-flow statement [8], on top of about $4.0 billion in FY2023 when the program began. The Board lifted the authorization by $20 billion in September 2025 to a $50 billion aggregate, of which $17.9 billion remained at fiscal year-end [9].
Source: FY2026 Annual Report (Form 10-K), Share Repurchase Program table [10]. Current price $170.77 as of 2026-07-17.
The prices paid tell their own story. The FY2024–FY2026 repurchases averaged $210, $260 and $254 a share [11]; the stock trades at $170.77 today. The last three years of buybacks were transacted 23% to 52% above the current quote — capital deployed into a stock the market has since marked down. The mirror image is that the same program is far more accretive at $171 than it was at $254, which is exactly the logic management is now invoking (below).
The harder number is what all that cash bought. Between FY2024 and FY2026 the program retired about 116 million shares gross [12], yet shares outstanding fell only from 997 million to 956 million — a net reduction of 41 million. Roughly two-thirds of the buyback was consumed offsetting stock-based compensation and employee-plan issuance. SBC ran $2.79 billion, $3.18 billion and $3.51 billion across those three years, about 8.4% of revenue [13].
Source: share count from fit_features.share_count_trend, derived from company filings; FY2017–FY2026.
This is the framework's central test for capital allocation, and Salesforce sits on the wrong side of the easy version of it. The deterministic feature file records the share count as rising — a positive five-year change of about 0.55% a year — and over the full decade the count climbed from 700 million to 956 million as stock-funded acquisitions (Slack, Tableau, MuleSoft) and compensation added shares faster than any buyback removed them. A share count that keeps rising on SBC and serial acquisitions is a framework hard-fail, and on the multi-year record that flag is tripped. The two-sided fact is that the trend inflected in FY2024: the count has fallen for three consecutive years as buyback spend finally overtook issuance. But the pace is modest — roughly a 1.4% net reduction per year — not the compounding retirement engine the framework is built around. At a hypothetical 10% adjusted yield the flywheel would retire close to a tenth of the float annually; Salesforce is delivering a small fraction of that, because the buyback is fighting its own compensation bill.
The levered exception does not apply and does not need to: it is reserved for balance sheets carrying a ~25%+ yield to justify the debt, and Salesforce is neither that levered nor that cheap.
Management's intent, from the record
Management has been explicit, and consistent, that the depressed price is the reason to lean in. On the Q4 FY2026 call Benioff tied the enlarged authorization directly to the drawdown: "we're using our remarkable cash flows to take advantage. This is not our first SaaSpocalypse… that's why we are doing this incredible repurchase authorization of $50 billion… because these are some low prices" [14]. He quantified the return: "In fiscal year '26, we returned more than $14 billion or 99% of our free cash flow to shareholders" [15]. Subsequent to that call the company commenced a $25 billion accelerated repurchase — half the entire authorization — explicitly framed against the low stock price, per the curated call record.
The counter-current is that management insists on a balanced allocation policy rather than a buyback-first one. Asked on the same call why not "lean harder" into acquisitions given the $50 billion authorization, the reply was that "there are many uses of cash such as dividends, buybacks, and acquisitions… Our approach focuses on using cash effectively and keeping our balance sheet strong," alongside a 5.8% dividend increase [16]. That is the tension the FY2026 spending pattern already made concrete — an $8 billion acquisition and a record buyback in the same year. For a framework that wants repurchases prioritized precisely when the yield tailwind is maximal, Salesforce's willingness is genuine and currently pointed the right way, but it is shared with an active acquisition appetite that can pull cash the other way. Insiders are not buying the dip in the open market — across the trailing Form 4 record the activity is option exercises, grants and tax-withholding, with just three small open-market purchases (SEC EDGAR Form 4 filings).
The absurdity check
At $170.77 the market values Salesforce equity at about $163.3 billion. Reported FY2026 free cash flow of $14.40 billion would retire the entire float in 11.3 years; net of the $3.51 billion SBC charge, about 15 years [17]. The feature file's float_retirement_years is not_computable because it depends on an adjusted-FCF figure the deterministic pipeline could not derive (see Yield); the arithmetic above uses reported free cash flow and is directional. The point is what the number is not: this is not the ~3-year float retirement that signals a price making an impossible claim. Eleven-plus years is an ordinary, un-dislocated figure — the buyback here is a support, not a coiled spring.
Dividend safety
The dividend is immaterial to the case. Salesforce initiated it in FY2025 and pays $0.44 a quarter after a 5.8% raise in February 2026 [18] — roughly a 1.0% yield, covered about nine times by free cash flow, with no downturn record to test because the payout is barely two years old.
Management credibility
The promise-versus-delivery record is the part that most cuts against the promotional-CEO exclusion. Salesforce runs a founder-CEO with a genuinely promotional register — "one of the best performances in software ever," the "SaaSpocalypse" framing [19] — which is exactly the pattern the framework treats as a red flag. But the exclusion is about big claims paired with repeated misses and no skin in the game, and on the checkable promises Salesforce has delivered.
Sources: Q1 FY2024 call [20]; Q4 FY2024 call [21]; Q4 FY2025 call [22]; Q4 FY2026 call [23].
Take the most material sample. After the January 2023 restructuring, management committed on the Q1 FY2024 call to a 30% non-GAAP operating margin by the first quarter of FY2025 and to "fully offset our stock-based compensation dilution through our share repurchases" [24]. It delivered a 30.5% full-year margin in FY2024, up 800 basis points [25], and 33% in FY2025 [26]; the share count did begin falling that same year. FY2026 revenue guidance of $41.0–41.3 billion closed at $41.5 billion [27]. Against that, one large forward promise is still open and unproven: a return to double-digit revenue growth in the second half of FY2027, hardened from a "possibility" to near-certainty across recent calls even as brokers press that Agentforce's usage metrics have not yet shown up in current remaining performance obligations. That is the credibility item to watch, and it belongs to the growth case rather than the balance sheet.
On skin in the game, Benioff beneficially owned 22,791,882 shares as of March 2026 — about 2.8% of the company, worth roughly $3.9 billion at the current price [28]. The proxy notes his holdings crossed Hart-Scott-Rodino thresholds through the vesting and continued retention of previously vested equity awards [29]. A founder with a multi-billion-dollar economic stake and a record of hitting his margin and revenue marks is not the promotional-executive-without-ownership pattern the framework excludes — the register is promotional, the delivery and the alignment are not.
Clock
Re-recognition here runs through printed quarters, not one event. The 59% fall from $367.87 to $150.12 was a multiple collapse, not an earnings cut — estimates rose the whole way down. The mechanisms that would close the gap are already turning: a $50 billion buyback running at management's stated low prices, revenue guided back to double digits by 2H FY2027, and an AI-cannibalization fear the Agentforce and seat numbers have not confirmed. Its one comparable drawdown took 28 months to round-trip.
What would close the gap
The dislocation is unusual for this framework: the price fell 59% while the earnings line kept rising. Consensus EPS for the current fiscal year was revised up by 44 analysts and down by none over the trailing 30 days, and the company has beaten every quarter since early FY2025. So the gap is not a broken number waiting to be repaired — it is a compressed multiple. At $170.77 against consensus FY2027 EPS of $14.13, the stock trades near 12 times forward earnings, a level it has not held in its public life. Four mechanisms can re-rate it, each with a date attached.
The buyback shrinks the denominator — now, at management's stated "low prices." In September 2025 the Board lifted the repurchase authorization to a $50.0 billion aggregate under a program running since August 2022 [1]. On the Q4 FY2026 call, management framed the acceleration explicitly against the sell-off — "this obviously is not a rational market… that's why we are doing this incredible repurchase authorization of $50 billion… these are some low prices" — and reported returning more than $14 billion, or 99% of free cash flow, to shareholders in FY2026 [2]. At the current $163.3 billion market cap, $14 billion of annual capital return retires roughly 8.6% of the equity each year, and the share count has already fallen from 997 million (FY2023) to 956 million (FY2026). This is the most mechanical of the four: it compounds intrinsic value per share on a quarterly cadence regardless of when sentiment turns.
Growth is guided to reaccelerate to double digits by the second half of FY2027. Management reaffirmed on the Q4 call a path "towards double-digit revenue growth by the second half of fiscal year '27," on the back of FY2026 revenue of $41.5 billion (+10%), CRPO of $35.1 billion (+16%), and total RPO of $72 billion (+14%) [3]. The counter-fact sits in the same call: CRPO growth of 9% was called "somewhat disappointing" by an analyst, and current-year revenue growth has decelerated from 11.2% (FY2024) to 8.7% (FY2025) before the guided reacceleration. The second half of FY2027 is the window where that guidance either prints or fails.
The feared event — AI agents cannibalizing seat-based software — has not shown up in the numbers. The bear narrative that de-rated the stock holds that Agentforce displaces the seats Salesforce sells. The company's own disclosure runs the other way so far: Agentforce reached roughly an $800 million business with 29,000 deals closed in its first 15 months, up 50% quarter-over-quarter, and customers in production up nearly 50% in Q4 [4], with management stating seats "are continuing to grow" [5]. A fear disproven in print is the classic re-rating trigger; the test dates are the next several earnings calls.
Multiple normalization is the residual. With the numbers intact, a re-rating from ~12x forward earnings requires only that the market stop pricing the AI thesis as terminal. That is not a dated catalyst — it is what the three mechanisms above are meant to force.
The dated catalyst path
Sources: earnings dates from the consensus earnings calendar (as reported); guidance milestone from the Q4 FY2026 earnings call [6]. Dreamforce window is the company's historical September–October cadence.
Capital allocation is not confined to repurchases: the Board also approved a 5.8% increase in the quarterly dividend on the same call [7], so the buyback tailwind is not being diverted to debt paydown at the moment it matters most.
Base rates from Salesforce's own history
Over its full listed history since 2004, Salesforce has drawn down 30% or more nine times. Two prior episodes match the current one in depth (roughly 55–70%); the rest were shallower and faster. The pattern that matters: the one directly comparable episode — a growth-multiple de-rate rather than a macro crash — took the longest to repair.
Source: derived from the run's daily price history, 2004–2026 (as reported). Depth = (trough close − peak close) / peak close.
Source: derived from the run's daily price history (as reported). Round-trip = peak date to the first close back at the prior peak; the current episode has not round-tripped.
The arithmetic the skeptic can recompute: the current drawdown ran from a $367.87 close on 2024-12-04 to a $150.12 close on 2026-06-22 — a 59.2% decline over 565 days, the longest peak-to-trough grind in the name's history. The stock has recovered to $170.77, about 13.8% off the trough, with the low set roughly a month before this reading. The closest analog is 2021–22: a 58.6% fall over 403 days that took 844 days — about 28 months — to round-trip to its prior high. The deeper 2008 episode round-tripped faster (about 18 months) but was a market-wide crash, not a Salesforce-specific narrative. What this name has not done in twenty years is round-trip a 55%-plus, company-specific de-rate inside 18 months.
Volume confirmed the selling was capitulation: peak-to-trough daily volume ran 3.5 times the pre-peak median (see Dislocation).
The 18-month test
Read against the mechanism and the base rate: partial re-recognition within 18–24 months is a reasonable expectation, but a full round-trip to the prior high inside that window is not what this name's history supports. The buyback compounds per-share value every quarter, consensus already models the forward free-cash-flow yield clearing 9.1% (FY2027) and 10.0% (FY2028) on the current market cap, and the growth reacceleration has a management-dated milestone in the second half of FY2027 — so the ingredients for the multiple to stop compressing are in place on an 18-month clock. But the one comparable episode in the record took roughly 28 months to fully repair, and the current drawdown only troughed about a month before this reading; the honest characterization is printed-quarter cycle repair over roughly two years, with the buyback doing the compounding in the interim, rather than a fast snapback. What would falsify this read: the guided double-digit reacceleration failing to print in the second half of FY2027, CRPO growth continuing to decelerate below 9%, or seat counts inflecting down as agents displace them — the framework's repricing-cycle and FCF-sliding falsifiers, tied to the ledger in Fit.
What consensus expects, and when
The sell side has not capitulated — and that cuts both ways. Fifty-two analysts carry a mean price target of $245.16 and a median of $238.03 against the $170.77 price, implying 40% upside, with a $475 high and a $160 low. Recommendations run 40 buy or strong-buy, 10 hold, and 2 strong-sell out of 52.
Source: consensus analyst estimates and price targets, as reported (CapIQ / consensus feed).
Under this framework, that reads two ways. The favorable reading: consensus forward free cash flow independently clears the yield bar (9.1% FY2027, 10.0% FY2028), so the sell side agrees on value while the buy side is the party that fled — the setup the framework prefers. The unfavorable reading: with 77% of analysts already at buy and targets already 40% above the price, the capitulated-street signal is absent. There is little upgrade fuel left in the sell side; the re-rating has to come from the buy side re-engaging with printed evidence, not from a wave of upgrades. The recommendation mix has in fact softened only slightly over three months (strong-buys 8 to 6), so the analysts largely never left.
As for when consensus expects the recovery in printed numbers: the estimates already show it. Consensus models FY2027 revenue of $46.1 billion (+11.0%) and EPS of $14.13 (+12.8%), then FY2028 revenue of $50.5 billion and EPS of $15.53. The numbers are not expected to fall and then recover — they are expected to keep rising. The candidate quarter for a re-rating is therefore the one that validates the guided reacceleration rather than any trough: the Q3 FY2027 print in early December 2026 and the Q4 FY2027 print in late February 2027, when "double-digit growth by the second half of FY2027" is either on the tape or it is not.
The instrument facts
These are facts, stated as facts — no strikes, no sizing, no advice.
Long-dated listed options exist on Salesforce, one of the most heavily traded single-name option chains in the US market. January 2028 LEAPS were listed on 15 September 2025 and, as of this reading in July 2026, sit roughly 18 months out, alongside the shorter January 2027 series; open interest and daily volume on the name are among the deepest in large-cap software, so long-dated liquidity is not a constraint. The framework's watchlist-only case (qualifying long-dated options absent) does not apply here — they exist.
On implied volatility: AlphaQuery reported Salesforce's 30-day implied volatility (calls) at 49.83% for 2026-07-21, with a separate reading in early July near 43–44% and above the 52-week median. That places current implied volatility at roughly 45–50% — the upper edge of the reference band this framework treats as acceptable (up to ~50–55), not yet in the elevated 60–70 zone. For context, 30-day realized volatility from the run's own price data was 37.9% on 2026-07-17, so options carry a modest premium to realized — consistent with an unresolved AI-narrative and an earnings date on 2 September 2026. Implied volatility is not estimated here; the figures above are the dated readings found, and they will move.